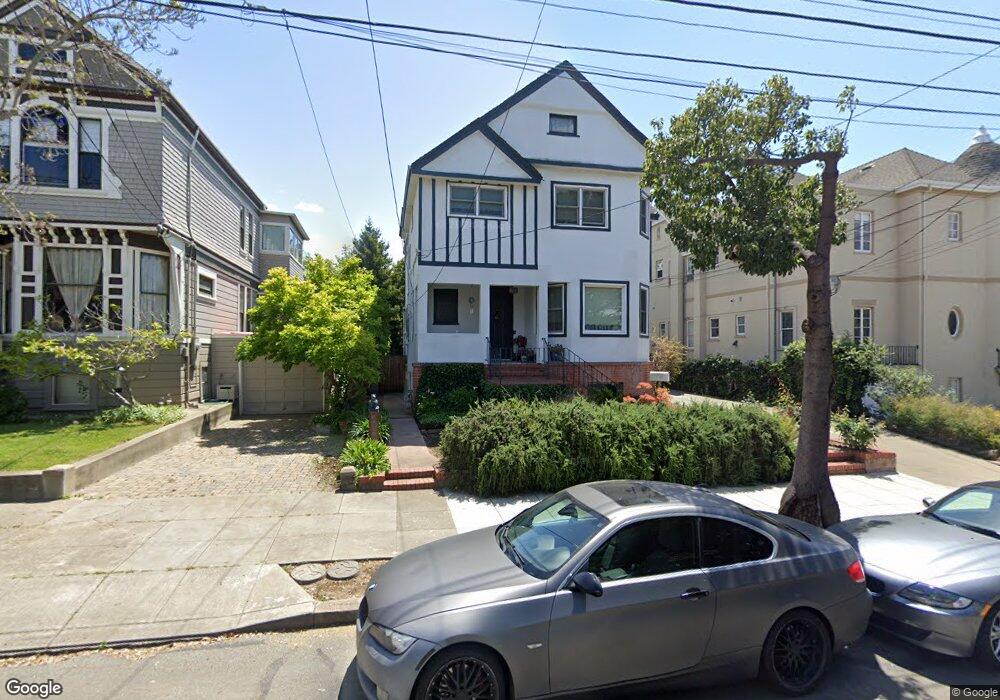
908 Lafayette St Alameda, CA 94501
South Shore NeighborhoodEstimated Value: $1,578,000 - $2,041,128
4
Beds
4
Baths
2,416
Sq Ft
$745/Sq Ft
Est. Value
About This Home
This home is located at 908 Lafayette St, Alameda, CA 94501 and is currently estimated at $1,800,282, approximately $745 per square foot. 908 Lafayette St is a home located in Alameda County with nearby schools including Love Elementary, Will C. Wood Middle School, and Alameda High School.
Ownership History
Date
Name
Owned For
Owner Type
Purchase Details
Closed on
Oct 31, 2018
Sold by
Worley Joanna and Joanna Worley Living Trust
Bought by
Nguyen Duc Tien and Vu Thi Ngoc Trinh
Current Estimated Value
Purchase Details
Closed on
Apr 12, 2018
Sold by
Worley Joanna L
Bought by
Worley Joanna and Joanna Worley Living Trust
Purchase Details
Closed on
May 4, 1999
Sold by
Theilade John E and Theilade Marie M
Bought by
Mcdaniel Collene M and Worley Joanna L
Home Financials for this Owner
Home Financials are based on the most recent Mortgage that was taken out on this home.
Original Mortgage
$300,000
Interest Rate
6.96%
Mortgage Type
Balloon
Purchase Details
Closed on
Apr 24, 1997
Sold by
Theilade John E
Bought by
Theilade John E and Theilade Marie M
Home Financials for this Owner
Home Financials are based on the most recent Mortgage that was taken out on this home.
Original Mortgage
$250,000
Interest Rate
8.25%
Create a Home Valuation Report for This Property
The Home Valuation Report is an in-depth analysis detailing your home's value as well as a comparison with similar homes in the area
Home Values in the Area
Average Home Value in this Area
Purchase History
| Date | Buyer | Sale Price | Title Company |
|---|---|---|---|
| Nguyen Duc Tien | $1,400,000 | Chicago Title Company | |
| Worley Joanna | -- | None Available | |
| Mcdaniel Collene M | $375,000 | First American Title Guarant | |
| Theilade John E | -- | California Land Title Co |
Source: Public Records
Mortgage History
| Date | Status | Borrower | Loan Amount |
|---|---|---|---|
| Previous Owner | Mcdaniel Collene M | $300,000 | |
| Previous Owner | Theilade John E | $250,000 | |
| Closed | Mcdaniel Collene M | $37,500 |
Source: Public Records
Tax History Compared to Growth
Tax History
| Year | Tax Paid | Tax Assessment Tax Assessment Total Assessment is a certain percentage of the fair market value that is determined by local assessors to be the total taxable value of land and additions on the property. | Land | Improvement |
|---|---|---|---|---|
| 2025 | $22,168 | $1,554,700 | $624,680 | $937,020 |
| 2024 | $22,168 | $1,524,081 | $612,432 | $918,649 |
| 2023 | $21,314 | $1,501,065 | $600,426 | $900,639 |
| 2022 | $20,837 | $1,464,637 | $588,655 | $882,982 |
| 2021 | $20,322 | $1,435,783 | $577,113 | $865,670 |
| 2020 | $20,075 | $1,428,000 | $571,200 | $856,800 |
| 2019 | $19,001 | $1,400,000 | $560,000 | $840,000 |
| 2018 | $8,118 | $516,660 | $154,998 | $361,662 |
| 2017 | $7,777 | $506,530 | $151,959 | $354,571 |
| 2016 | $7,769 | $496,600 | $148,980 | $347,620 |
| 2015 | $7,734 | $489,141 | $146,742 | $342,399 |
| 2014 | $7,452 | $479,560 | $143,868 | $335,692 |
Source: Public Records
Map
Nearby Homes
- 1812 San Antonio Ave
- 1220 Chestnut St
- 2008 Alameda Ave
- 2060 San Antonio Ave
- 610 Grand St
- 608 Fortress Isle
- 2031 Otis Dr Unit H
- 2051 Alameda Ave
- 2120 Encinal Ave
- 1421 Chestnut St
- 2106 Otis Dr Unit D
- 1701 Central Ave Unit P
- 2119 Alameda Ave
- 2057 Central Ave
- 2137 Otis Dr Unit 322
- 2137 Otis Dr Unit 111
- 2056 Santa Clara Ave
- 1019 Sherman St
- 2151 Alameda Ave
- 1941 Franciscan Way
- 912 Lafayette St
- 918 Lafayette St
- 905 Chestnut St
- 911 Chestnut St
- 915 Chestnut St
- 901 Chestnut St
- 1837 Clinton Ave
- 911 Lafayette St
- 922 Lafayette St
- 915 Lafayette St
- 925 Chestnut St
- 1904 Clinton Ave
- 928 Lafayette St
- 1910 San Jose Ave
- 1908 Clinton Ave
- 929 Lafayette St
- 931 Chestnut St Unit B
- 931 Chestnut St
- 1912 Clinton Ave
- 1834 San Jose Ave