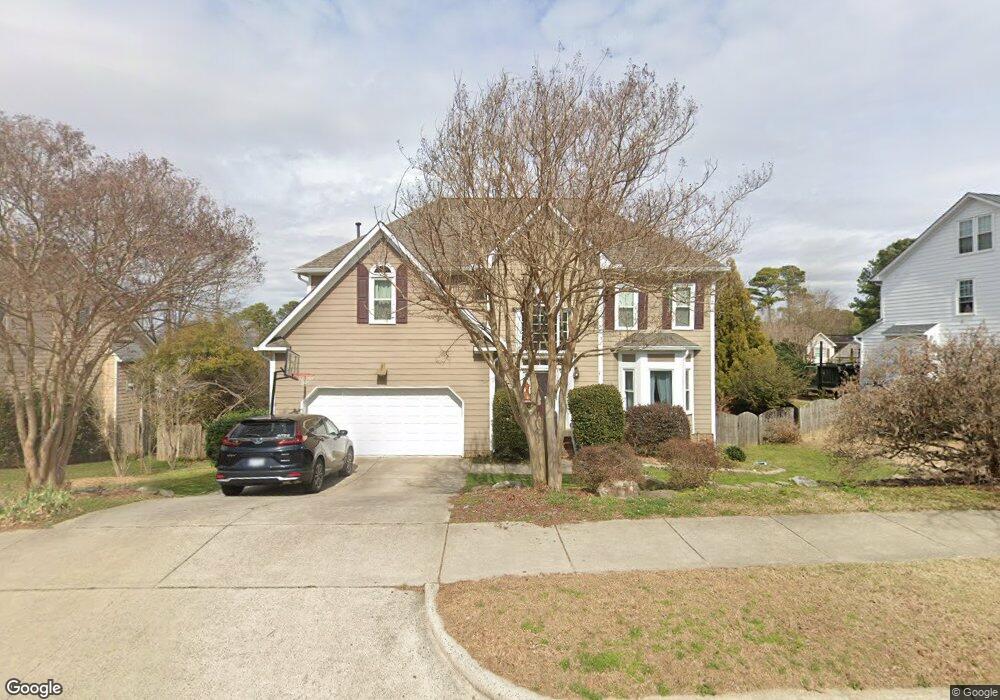
908 Newington Way Apex, NC 27502
Beaver Creek NeighborhoodEstimated Value: $689,308 - $752,000
4
Beds
3
Baths
2,968
Sq Ft
$243/Sq Ft
Est. Value
About This Home
This home is located at 908 Newington Way, Apex, NC 27502 and is currently estimated at $721,077, approximately $242 per square foot. 908 Newington Way is a home located in Wake County with nearby schools including Salem Elementary, Salem Middle, and Apex High School.
Ownership History
Date
Name
Owned For
Owner Type
Purchase Details
Closed on
Aug 6, 2015
Sold by
Poole James and Poole Stacey
Bought by
Henry Eric and Henry Julia
Current Estimated Value
Home Financials for this Owner
Home Financials are based on the most recent Mortgage that was taken out on this home.
Original Mortgage
$300,000
Outstanding Balance
$236,029
Interest Rate
4.04%
Mortgage Type
New Conventional
Estimated Equity
$485,048
Purchase Details
Closed on
May 26, 1999
Sold by
Parker & Lancaster Corp
Bought by
Poole James and Poole Stacey
Home Financials for this Owner
Home Financials are based on the most recent Mortgage that was taken out on this home.
Original Mortgage
$176,800
Interest Rate
6.94%
Purchase Details
Closed on
Jul 29, 1998
Sold by
Haddon Hall Ltd Partnership
Bought by
Parker & Lancaster Corp
Create a Home Valuation Report for This Property
The Home Valuation Report is an in-depth analysis detailing your home's value as well as a comparison with similar homes in the area
Home Values in the Area
Average Home Value in this Area
Purchase History
| Date | Buyer | Sale Price | Title Company |
|---|---|---|---|
| Henry Eric | $375,000 | Attorney | |
| Poole James | $221,000 | -- | |
| Parker & Lancaster Corp | $40,000 | -- |
Source: Public Records
Mortgage History
| Date | Status | Borrower | Loan Amount |
|---|---|---|---|
| Open | Henry Eric | $300,000 | |
| Previous Owner | Poole James | $176,800 |
Source: Public Records
Tax History Compared to Growth
Tax History
| Year | Tax Paid | Tax Assessment Tax Assessment Total Assessment is a certain percentage of the fair market value that is determined by local assessors to be the total taxable value of land and additions on the property. | Land | Improvement |
|---|---|---|---|---|
| 2025 | $5,556 | $634,064 | $190,000 | $444,064 |
| 2024 | $5,432 | $634,064 | $190,000 | $444,064 |
| 2023 | $4,345 | $394,277 | $92,000 | $302,277 |
| 2022 | $4,079 | $394,277 | $92,000 | $302,277 |
| 2021 | $3,923 | $394,277 | $92,000 | $302,277 |
| 2020 | $3,884 | $394,277 | $92,000 | $302,277 |
| 2019 | $3,922 | $343,598 | $92,000 | $251,598 |
| 2018 | $3,694 | $343,598 | $92,000 | $251,598 |
| 2017 | $3,439 | $343,598 | $92,000 | $251,598 |
| 2016 | $3,389 | $343,598 | $92,000 | $251,598 |
| 2015 | -- | $335,140 | $84,000 | $251,140 |
| 2014 | -- | $335,140 | $84,000 | $251,140 |
Source: Public Records
Map
Nearby Homes
- 303 Knightsborough Way
- 907 Haddon Hall Dr
- 1209 Haywards Heath Ln
- 102 Darley Dale Loop
- 232 Eyam Hall Ln
- 235 Eyam Hall Ln
- 427 Eyam Hall Ln
- 105 Troyer Place
- 506 W Chatham St
- 919 Branch Line Ln
- 1800 Pierre Place
- 1111 Platform Dr
- 953 Ambergate Station
- 1115 Platform Dr
- 202 W Chatham St
- 7736 Roberts Rd
- 547 Grand Central Station
- 996 Tender Dr
- 596 Grand Central Station
- 1105 Capitata Crossing
- 910 Newington Way
- 906 Newington Way
- 817 Haddon Hall Dr
- 819 Haddon Hall Dr
- 909 Newington Way
- 813 Haddon Hall Dr
- 912 Newington Way
- 907 Newington Way
- 911 Newington Way
- 821 Haddon Hall Dr
- 905 Newington Way
- 903 Newington Way
- 914 Newington Way
- 913 Newington Way
- 903 N York Ct
- 916 Haywards Heath Ln
- 916 Haywards Hearth Ln
- LOT 82 Haddon Hall
- 914 Haywards Heath Ln
- 914 Haywards Hearth Ln