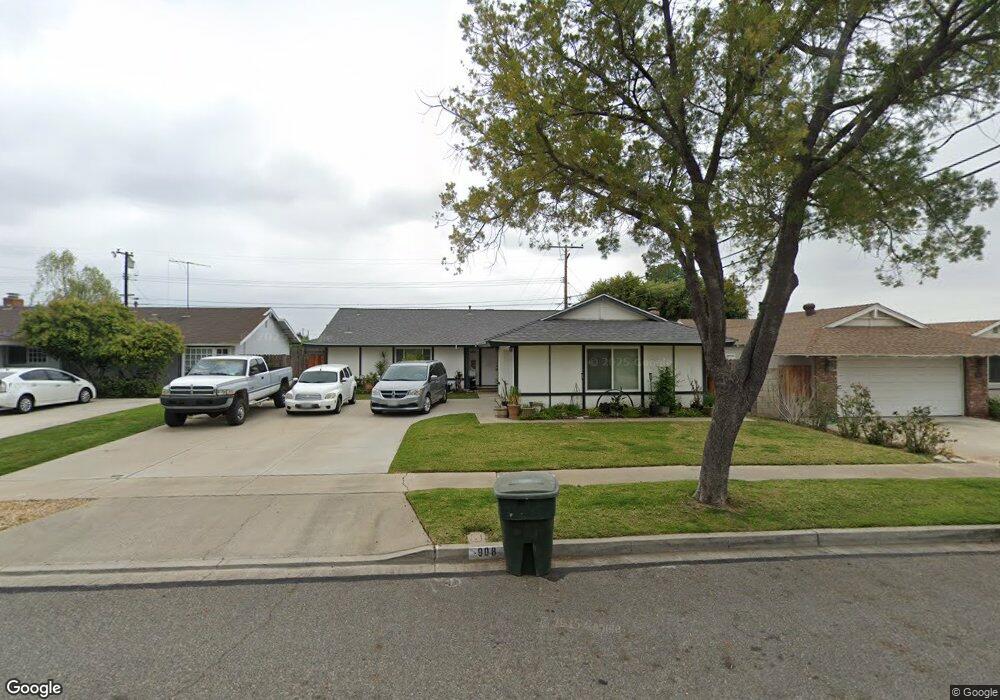
908 Ott Ave Placentia, CA 92870
Estimated Value: $986,365 - $1,143,000
3
Beds
2
Baths
1,392
Sq Ft
$769/Sq Ft
Est. Value
About This Home
This home is located at 908 Ott Ave, Placentia, CA 92870 and is currently estimated at $1,070,091, approximately $768 per square foot. 908 Ott Ave is a home located in Orange County with nearby schools including Wagner Elementary School, Col. J. K. Tuffree Middle School, and El Dorado High School.
Ownership History
Date
Name
Owned For
Owner Type
Purchase Details
Closed on
Jun 28, 2024
Sold by
Cook Leland Carl and Cook Debra Kay
Bought by
Leland Carl Cook And Debra Kay Cook Family Tr and Cook
Current Estimated Value
Purchase Details
Closed on
Nov 23, 2011
Sold by
Neilson Julie A
Bought by
Neilson David H and Neilson Catherine M
Home Financials for this Owner
Home Financials are based on the most recent Mortgage that was taken out on this home.
Original Mortgage
$319,200
Interest Rate
4.06%
Mortgage Type
New Conventional
Create a Home Valuation Report for This Property
The Home Valuation Report is an in-depth analysis detailing your home's value as well as a comparison with similar homes in the area
Home Values in the Area
Average Home Value in this Area
Purchase History
| Date | Buyer | Sale Price | Title Company |
|---|---|---|---|
| Leland Carl Cook And Debra Kay Cook Family Tr | -- | None Listed On Document | |
| Neilson David H | -- | Lsi |
Source: Public Records
Mortgage History
| Date | Status | Borrower | Loan Amount |
|---|---|---|---|
| Previous Owner | Neilson David H | $319,200 |
Source: Public Records
Tax History
| Year | Tax Paid | Tax Assessment Tax Assessment Total Assessment is a certain percentage of the fair market value that is determined by local assessors to be the total taxable value of land and additions on the property. | Land | Improvement |
|---|---|---|---|---|
| 2025 | $4,138 | $311,982 | $198,327 | $113,655 |
| 2024 | $4,138 | $305,865 | $194,438 | $111,427 |
| 2023 | $4,027 | $299,868 | $190,625 | $109,243 |
| 2022 | $3,936 | $293,989 | $186,888 | $107,101 |
| 2021 | $3,816 | $288,225 | $183,224 | $105,001 |
| 2020 | $3,757 | $285,270 | $181,345 | $103,925 |
| 2019 | $3,599 | $279,677 | $177,789 | $101,888 |
| 2018 | $3,549 | $274,194 | $174,303 | $99,891 |
| 2017 | $3,486 | $268,818 | $170,885 | $97,933 |
| 2016 | $3,417 | $263,548 | $167,535 | $96,013 |
| 2015 | $3,369 | $259,590 | $165,019 | $94,571 |
| 2014 | $3,277 | $254,505 | $161,786 | $92,719 |
Source: Public Records
Map
Nearby Homes
- 724 Longfellow Dr
- 2123 Earnshaw Dr
- 2102 Mignon Way
- 630 Shady Ln
- 1837 Kelleher Place
- 5142 Hamer Ln
- 1509 Prospect Ave Unit D
- 408 Somerset Dr
- 2313 Navigation Cir
- 4469 La Serena Dr
- 931 Carina Ave
- 1418 Avenida de Vaca
- 455 Purdy Ave
- 1963 Wilcox Unit 4-6
- 1232 Woodside Dr
- 308 Somerset Dr
- 1410 Via Cortez
- 324 Rio Grande Ave
- 338 Purdy Ave
- 3292 Greenleaf Dr
Your Personal Tour Guide
Ask me questions while you tour the home.