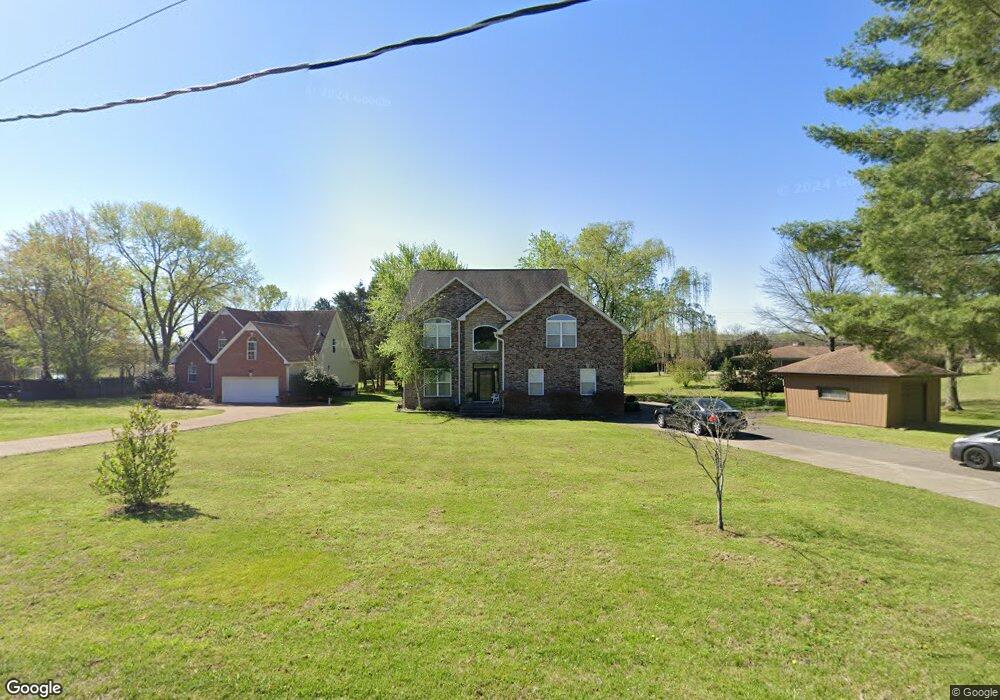
908 Pointview Cir Mount Juliet, TN 37122
Estimated Value: $502,296 - $864,000
--
Bed
3
Baths
2,568
Sq Ft
$266/Sq Ft
Est. Value
About This Home
This home is located at 908 Pointview Cir, Mount Juliet, TN 37122 and is currently estimated at $683,074, approximately $265 per square foot. 908 Pointview Cir is a home located in Wilson County with nearby schools including West Elementary School, West Wilson Middle School, and Mt. Juliet High School.
Ownership History
Date
Name
Owned For
Owner Type
Purchase Details
Closed on
Feb 6, 2009
Sold by
Jones Jack
Bought by
Rader Dennis
Current Estimated Value
Purchase Details
Closed on
Sep 12, 2008
Sold by
Pinnacle National Bank
Bought by
Jack Jones
Purchase Details
Closed on
Aug 26, 2008
Sold by
Mark Rodgers J
Bought by
Pinnacle National Bank
Purchase Details
Closed on
Oct 13, 2004
Sold by
Tacopa Land Llc
Bought by
Mark Rodgers J
Home Financials for this Owner
Home Financials are based on the most recent Mortgage that was taken out on this home.
Original Mortgage
$230,000
Interest Rate
5.73%
Purchase Details
Closed on
May 12, 2004
Sold by
Tony Baca
Bought by
Tacopa Land Llc
Purchase Details
Closed on
Jul 15, 1987
Bought by
Baca Tony
Purchase Details
Closed on
May 7, 1987
Bought by
Watson Lillian Virginia
Purchase Details
Closed on
Aug 19, 1983
Bought by
Watson Luther
Create a Home Valuation Report for This Property
The Home Valuation Report is an in-depth analysis detailing your home's value as well as a comparison with similar homes in the area
Home Values in the Area
Average Home Value in this Area
Purchase History
| Date | Buyer | Sale Price | Title Company |
|---|---|---|---|
| Rader Dennis | $266,000 | -- | |
| Jack Jones | $210,000 | -- | |
| Pinnacle National Bank | $231,032 | -- | |
| Mark Rodgers J | $230,000 | -- | |
| Tacopa Land Llc | $47,962 | -- | |
| Baca Tony | -- | -- | |
| Watson Lillian Virginia | -- | -- | |
| Watson Luther | -- | -- |
Source: Public Records
Mortgage History
| Date | Status | Borrower | Loan Amount |
|---|---|---|---|
| Previous Owner | Watson Luther | $230,000 |
Source: Public Records
Tax History Compared to Growth
Tax History
| Year | Tax Paid | Tax Assessment Tax Assessment Total Assessment is a certain percentage of the fair market value that is determined by local assessors to be the total taxable value of land and additions on the property. | Land | Improvement |
|---|---|---|---|---|
| 2024 | $1,750 | $91,675 | $20,000 | $71,675 |
| 2022 | $1,750 | $91,675 | $20,000 | $71,675 |
| 2021 | $1,706 | $91,675 | $20,000 | $71,675 |
| 2020 | $1,990 | $89,375 | $20,000 | $69,375 |
| 2019 | $1,990 | $79,000 | $13,750 | $65,250 |
| 2018 | $1,990 | $79,000 | $13,750 | $65,250 |
| 2017 | $1,990 | $79,000 | $13,750 | $65,250 |
| 2016 | $1,990 | $79,000 | $13,750 | $65,250 |
| 2015 | $2,031 | $79,000 | $13,750 | $65,250 |
| 2014 | $1,490 | $57,970 | $0 | $0 |
Source: Public Records
Map
Nearby Homes
- 809 Burton Point Rd
- 817 Burton Point Rd
- 238 Ridgewater Way
- 222 Ridgewater Way
- 1036 C P Stewart Blvd
- 1021 C P Stewart Blvd
- 1307 Christina Ct
- 19 Harbor Dr
- 505 Lena Way
- 379 Gilley Rd
- 507 Lena Way
- 5585 Highway 109 N
- 55 Colonial Dr
- 1007 Chateau Dr
- 1 Cooks Rd
- 0 Creighton Ln
- 1104 Port William Ct
- 185 Creighton Ln
- 61 Creighton Ln
- 213 Bradshaw Rd
- 910 Pointview Cir
- 900 Pointview Cir
- 912 Pointview Cir
- 912 Pointview Cir
- 907 Pointview Cir
- 905 Pointview Cir
- 914 Pointview Cir
- 914 Pointview Cir
- 911 Pointview Cir
- 903 Pointview Cir
- 407 Avalon Island
- 985 Pointview Cir
- 987 Pointview Cir
- 916 Pointview Cir
- 901 Pointview Cir
- 983 Pointview Cir
- 410 Avalon Isle
- 989 Pointview Cir
- 34 Avalon Isle- Unit 34
- 919 Pointview Cir