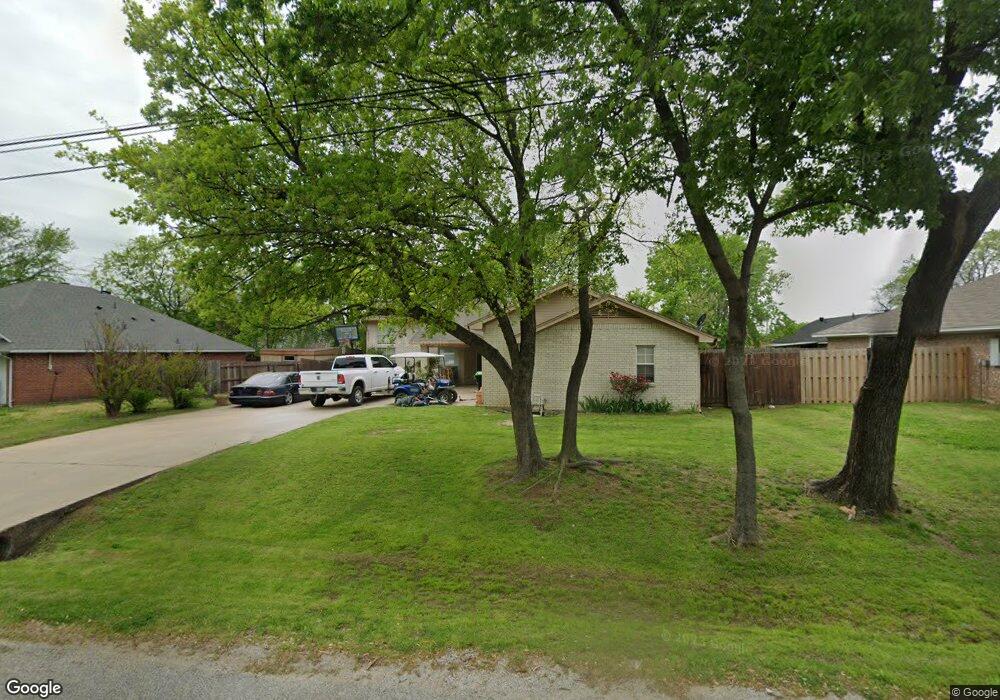
908 S Jefferson St Pilot Point, TX 76258
Estimated Value: $266,585 - $277,000
3
Beds
2
Baths
1,441
Sq Ft
$188/Sq Ft
Est. Value
About This Home
This home is located at 908 S Jefferson St, Pilot Point, TX 76258 and is currently estimated at $270,396, approximately $187 per square foot. 908 S Jefferson St is a home located in Denton County with nearby schools including Pilot Point Early Childhood Center, Pilot Point Elementary School, and Pilot Point Middle School.
Ownership History
Date
Name
Owned For
Owner Type
Purchase Details
Closed on
Mar 19, 2007
Sold by
Heckaman Margaret A
Bought by
Heckaman Lori Ann and Heckaman Stephen Paul
Current Estimated Value
Purchase Details
Closed on
Jul 13, 1998
Sold by
Alexander Michael Guy and Alexander Jackie Grace
Bought by
Heckaman Margaret A
Purchase Details
Closed on
Sep 23, 1996
Sold by
Foutch Cecil Martin and Foutch Michele N
Bought by
Alexander Michael Guy and Alexander Jackie Grace
Home Financials for this Owner
Home Financials are based on the most recent Mortgage that was taken out on this home.
Original Mortgage
$70,000
Interest Rate
7.9%
Purchase Details
Closed on
Aug 30, 1994
Sold by
Pedigo Real Estate Inc
Bought by
Foutch Cecil Martin and Foutch Michele N
Home Financials for this Owner
Home Financials are based on the most recent Mortgage that was taken out on this home.
Original Mortgage
$59,000
Interest Rate
8.52%
Mortgage Type
Purchase Money Mortgage
Create a Home Valuation Report for This Property
The Home Valuation Report is an in-depth analysis detailing your home's value as well as a comparison with similar homes in the area
Home Values in the Area
Average Home Value in this Area
Purchase History
| Date | Buyer | Sale Price | Title Company |
|---|---|---|---|
| Heckaman Lori Ann | -- | None Available | |
| Heckaman Margaret A | -- | -- | |
| Alexander Michael Guy | -- | -- | |
| Foutch Cecil Martin | -- | -- |
Source: Public Records
Mortgage History
| Date | Status | Borrower | Loan Amount |
|---|---|---|---|
| Previous Owner | Alexander Michael Guy | $70,000 | |
| Previous Owner | Foutch Cecil Martin | $59,000 | |
| Closed | Foutch Cecil Martin | $10,500 |
Source: Public Records
Tax History Compared to Growth
Tax History
| Year | Tax Paid | Tax Assessment Tax Assessment Total Assessment is a certain percentage of the fair market value that is determined by local assessors to be the total taxable value of land and additions on the property. | Land | Improvement |
|---|---|---|---|---|
| 2025 | $955 | $234,663 | $54,304 | $180,359 |
| 2024 | $4,665 | $259,147 | $0 | $0 |
| 2023 | $955 | $235,588 | $54,304 | $222,481 |
| 2022 | $4,403 | $214,171 | $44,248 | $171,639 |
| 2021 | $4,017 | $194,701 | $44,248 | $150,453 |
| 2020 | $3,686 | $177,383 | $21,722 | $163,178 |
| 2019 | $3,454 | $161,258 | $21,722 | $167,640 |
| 2018 | $3,180 | $146,598 | $19,710 | $141,362 |
| 2017 | $2,899 | $133,271 | $18,504 | $123,364 |
| 2016 | $2,636 | $121,155 | $18,025 | $112,652 |
| 2015 | $1,748 | $110,141 | $18,025 | $92,116 |
| 2014 | $1,748 | $104,396 | $21,802 | $82,594 |
| 2013 | -- | $97,434 | $21,802 | $75,632 |
Source: Public Records
Map
Nearby Homes
- 717 S Church St
- 00 U S Route 377
- TBD W Clifton St
- 405 W Clifton St
- 1001 S Highway 377
- 13 Acs Strittmatter Rd
- 45 Acres Strittmatter Rd
- 400 S Washington St
- 510 S Irick St
- 511 S Irick St
- 300 S Jefferson St
- 301 E Division St
- 308 S Sherman St
- 192 Lakeview Cir
- 188 Lakeview Cir
- 504 S Kirby St
- 517 S Kirby St
- 184 Lakeview Cir
- 836 Debbie Ln
- 317 E Liberty St
- 914 S Jefferson St
- 900 S Jefferson St
- 109 W Flake St
- 920 S Jefferson St
- 115 W Flake St
- 909 S Jefferson St
- 926 S Jefferson St
- 826 S Jefferson St
- 108 W Flake St
- 909 S Washington St
- 901 S Washington St
- 1000 S Jefferson St
- 112 W Flake St
- 820 S Jefferson St
- 00000 S Washington St
- 819 S Washington St
- 1001 S Jefferson St
- 1006 S Jefferson St
- 815 S Washington St
- 808 S Jefferson St