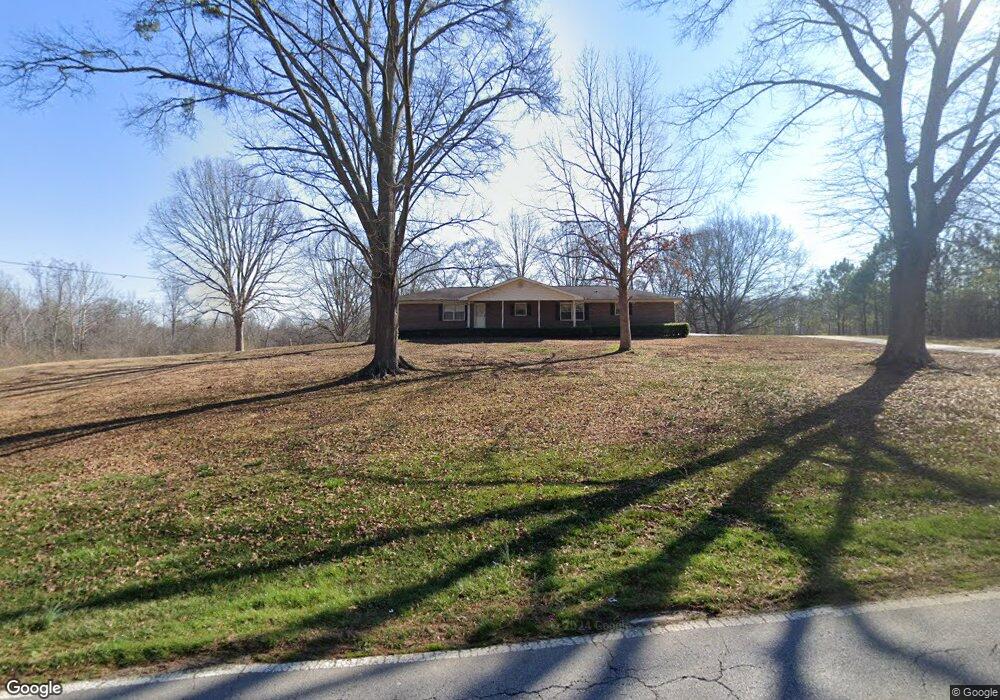
908 S van Wert Rd Villa Rica, GA 30180
Estimated Value: $221,000 - $262,440
4
Beds
1
Bath
1,732
Sq Ft
$141/Sq Ft
Est. Value
About This Home
This home is located at 908 S van Wert Rd, Villa Rica, GA 30180 and is currently estimated at $243,860, approximately $140 per square foot. 908 S van Wert Rd is a home located in Carroll County with nearby schools including Villa Rica Elementary School, Villa Rica Middle School, and Villa Rica High School.
Ownership History
Date
Name
Owned For
Owner Type
Purchase Details
Closed on
Aug 27, 2024
Sold by
Soverns Alexandra Brooke
Bought by
Newby Quinton Howard and Soverns Alexandra Brooke
Current Estimated Value
Home Financials for this Owner
Home Financials are based on the most recent Mortgage that was taken out on this home.
Original Mortgage
$222,527
Outstanding Balance
$220,146
Interest Rate
6.73%
Mortgage Type
New Conventional
Estimated Equity
$23,714
Purchase Details
Closed on
Oct 14, 2016
Sold by
Brown Betty D
Bought by
Russell Jeannetta Lynn
Home Financials for this Owner
Home Financials are based on the most recent Mortgage that was taken out on this home.
Original Mortgage
$93,279
Interest Rate
3.62%
Mortgage Type
FHA
Purchase Details
Closed on
Oct 17, 2002
Sold by
Driver Glady Est
Bought by
Brown Henry L and Brown Betty D
Purchase Details
Closed on
Jun 17, 1994
Bought by
Driver Hersschal
Create a Home Valuation Report for This Property
The Home Valuation Report is an in-depth analysis detailing your home's value as well as a comparison with similar homes in the area
Home Values in the Area
Average Home Value in this Area
Purchase History
| Date | Buyer | Sale Price | Title Company |
|---|---|---|---|
| Newby Quinton Howard | -- | -- | |
| Soverns Alexandra Brooke | -- | -- | |
| Soverns Alexandra Brooke | $243,000 | -- | |
| Russell Jeannetta Lynn | $95,000 | -- | |
| Brown Betty D | -- | -- | |
| Brown Henry L | $40,000 | -- | |
| Driver Hersschal | -- | -- |
Source: Public Records
Mortgage History
| Date | Status | Borrower | Loan Amount |
|---|---|---|---|
| Open | Soverns Alexandra Brooke | $222,527 | |
| Previous Owner | Brown Betty D | $93,279 |
Source: Public Records
Tax History Compared to Growth
Tax History
| Year | Tax Paid | Tax Assessment Tax Assessment Total Assessment is a certain percentage of the fair market value that is determined by local assessors to be the total taxable value of land and additions on the property. | Land | Improvement |
|---|---|---|---|---|
| 2024 | $1,639 | $70,139 | $9,720 | $60,419 |
| 2023 | $1,639 | $64,635 | $9,720 | $54,915 |
| 2022 | $1,326 | $50,198 | $6,480 | $43,718 |
| 2021 | $1,159 | $42,272 | $4,800 | $37,472 |
| 2020 | $1,063 | $38,272 | $4,800 | $33,472 |
| 2019 | $968 | $34,851 | $4,800 | $30,051 |
| 2018 | $895 | $30,941 | $4,800 | $26,141 |
| 2017 | $907 | $30,941 | $4,800 | $26,141 |
| 2016 | $1,016 | $30,941 | $4,800 | $26,141 |
| 2015 | $771 | $22,358 | $6,000 | $16,359 |
| 2014 | $776 | $22,359 | $6,000 | $16,359 |
Source: Public Records
Map
Nearby Homes
- 109 Spring Haven Ct
- 1916 Pleasant Grove Church Rd
- 1100 Pleasant Grove Church Rd
- 127 Autumn Run Place
- 1024 Topaz Ln
- 1509 Pleasant Grove Church Rd
- 10 S Villa Rd
- 158 N Villa Rd
- 605 Rocky Branch Rd
- 902 N Lassetter Cir
- 309 Winton Way
- 412 Towson St
- Cosmos Plan at The Emery
- 414 Towson St
- 313 Winton Way
- 315 Winton Way
- 412 Winton Way
- 908 S van Wert Rd
- 908 S van Wert Rd
- 908 S van Wert Rd
- 908 S van Wert Rd
- 908 S van Wert Rd
- 903 S van Wert Rd
- 905 S van Wert Rd
- 35 Copper Leaf Ct
- 35 Copper Leaf Ct Unit 14
- 27 Copper Leaf Ct
- 43 Copper Leaf Ct
- 47 Copper Leaf Ct
- 47 Copper Leaf Ct
- 47 Copper Leaf Ct
- 1001 S van Wert Rd
- 1100 S van Wert Rd
- 1009 S van Wert Rd
- 1193 S van Wert Rd
- 83 Church Rd
- 0 Pope Church Road (Lot 4)