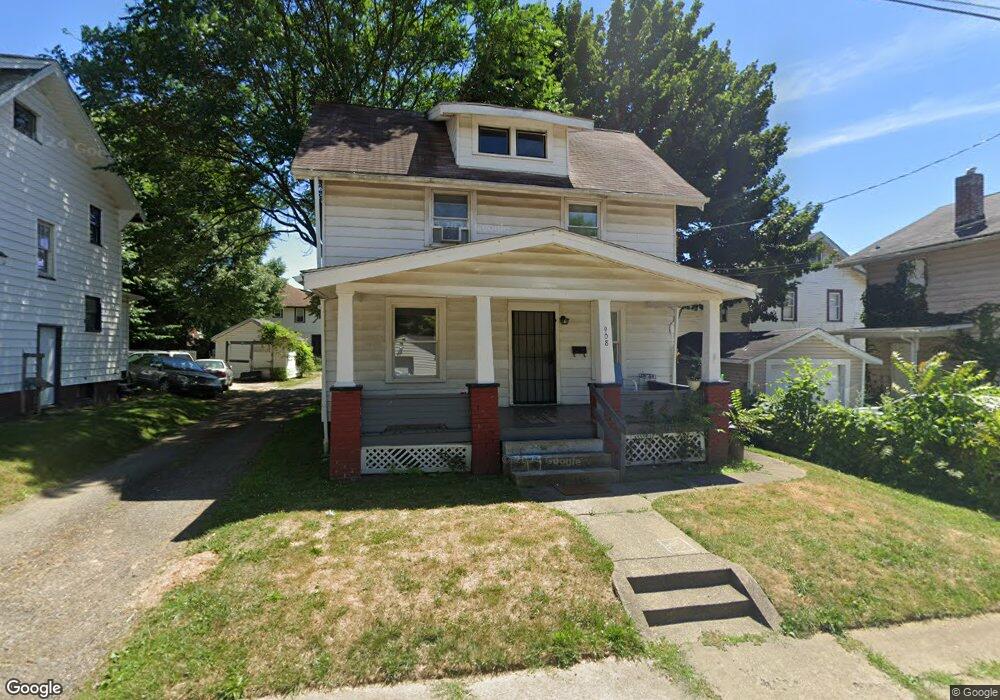
908 Sherlock Place NE Canton, OH 44714
Gibbs Area NeighborhoodEstimated Value: $65,000 - $92,000
3
Beds
1
Bath
1,040
Sq Ft
$76/Sq Ft
Est. Value
About This Home
This home is located at 908 Sherlock Place NE, Canton, OH 44714 and is currently estimated at $79,102, approximately $76 per square foot. 908 Sherlock Place NE is a home located in Stark County with nearby schools including Early Learning Center @ Schreiber, Gibbs Elementary School, and Youtz Intermediate School.
Ownership History
Date
Name
Owned For
Owner Type
Purchase Details
Closed on
Jul 11, 2018
Sold by
Lemus Veralice Calderon
Bought by
Yoder Ira John E and Equity Trust
Current Estimated Value
Purchase Details
Closed on
Sep 28, 2011
Sold by
Fannie Mae
Bought by
Lemus Veralice Calderon
Purchase Details
Closed on
Sep 16, 2011
Sold by
Bell Denise K
Bought by
Fannie Mae and Federal National Mortgage Association
Purchase Details
Closed on
Jan 23, 2001
Sold by
Residential Solutions Inc
Bought by
Murdock Raymond H and Murdock Dolores J
Purchase Details
Closed on
May 23, 2000
Sold by
James Pyle
Bought by
The Chase Manhattan Bank
Purchase Details
Closed on
Apr 24, 2000
Sold by
Chase Manhattan Bank
Bought by
Residential Solutions Inc
Purchase Details
Closed on
Apr 14, 2000
Sold by
James Pyle
Bought by
Chase Manhattan Bank
Create a Home Valuation Report for This Property
The Home Valuation Report is an in-depth analysis detailing your home's value as well as a comparison with similar homes in the area
Home Values in the Area
Average Home Value in this Area
Purchase History
| Date | Buyer | Sale Price | Title Company |
|---|---|---|---|
| Yoder Ira John E | $18,000 | None Available | |
| Lemus Veralice Calderon | $6,200 | Attorney | |
| Fannie Mae | $24,000 | Attorney | |
| Murdock Raymond H | $15,000 | -- | |
| The Chase Manhattan Bank | $18,000 | -- | |
| Residential Solutions Inc | $22,500 | -- | |
| Chase Manhattan Bank | $18,000 | -- |
Source: Public Records
Tax History Compared to Growth
Tax History
| Year | Tax Paid | Tax Assessment Tax Assessment Total Assessment is a certain percentage of the fair market value that is determined by local assessors to be the total taxable value of land and additions on the property. | Land | Improvement |
|---|---|---|---|---|
| 2025 | -- | $15,550 | $2,140 | $13,410 |
| 2024 | -- | $15,790 | $2,140 | $13,650 |
| 2023 | $540 | $8,830 | $1,650 | $7,180 |
| 2022 | $549 | $9,180 | $1,650 | $7,530 |
| 2021 | $555 | $9,180 | $1,650 | $7,530 |
| 2020 | $473 | $7,000 | $1,330 | $5,670 |
| 2019 | $415 | $7,000 | $1,330 | $5,670 |
| 2018 | $407 | $7,000 | $1,330 | $5,670 |
| 2017 | $442 | $6,930 | $1,890 | $5,040 |
| 2016 | $444 | $6,930 | $1,890 | $5,040 |
| 2015 | $446 | $6,930 | $1,890 | $5,040 |
| 2014 | $491 | $7,180 | $1,960 | $5,220 |
| 2013 | $239 | $7,180 | $1,960 | $5,220 |
Source: Public Records
Map
Nearby Homes
- 1332 Spring Ave NE
- 1412 Miami Ct NE
- 1422 Plain Ave NE
- 1322 Struble Ave NE
- 1376 Cherry Ave NE
- 1454 Spring Ave NE
- 0 Young Ave NE Unit 5145944
- 1325 Maddrell Ct NE
- 1447 Shriver Ave NE
- 1540 Miami Ct NE
- 211 15th St NE
- 1611 Rowland Ave NE
- 1525 14th St NE
- 1515 Parkhill Place NE
- 1421 Market Ave N
- 1605 12th St NE
- 1226 Logan Ave NW
- 1328 Logan Ave NW
- 1631 Shriver Ave NE
- 1210 17th St NE
- 912 Sherlock Place NE
- 1318 Plain Ave NE
- 1314 Plain Ave NE
- 918 Sherlock Place NE
- 1324 Plain Ave NE
- 1306 Plain Ave NE
- 913 13th St NE
- 1000 Sherlock Place NE
- 1328 Plain Ave NE
- 919 13th St NE
- 1300 Plain Ave NE
- 1005 Sherlock Place NE
- 1315 Plain Ave NE
- 1321 Plain Ave NE
- 1004 Sherlock Place NE
- 1001 13th St NE
- 1007 Sherlock Place NE
- 1336 Plain Ave NE
- 1311 Plain Ave NE
- 1325 Plain Ave NE