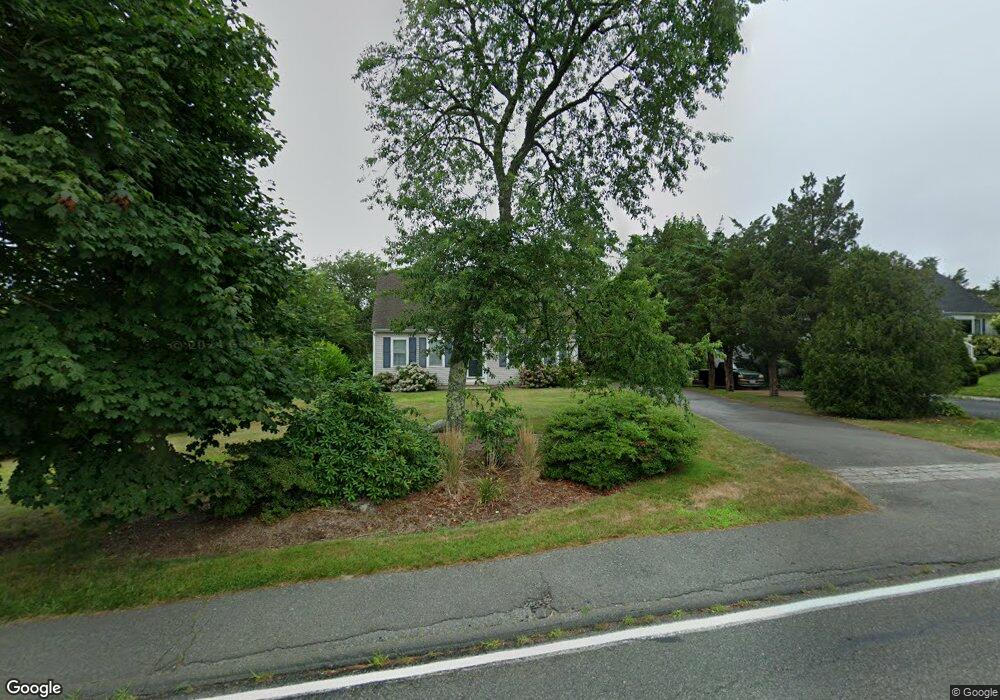
908 Shore Rd Pocasset, MA 02559
Pocasset NeighborhoodEstimated Value: $600,000 - $737,000
3
Beds
2
Baths
1,547
Sq Ft
$428/Sq Ft
Est. Value
About This Home
This home is located at 908 Shore Rd, Pocasset, MA 02559 and is currently estimated at $661,855, approximately $427 per square foot. 908 Shore Rd is a home located in Barnstable County with nearby schools including Bourne High School and Cadence Academy Preschool - Bourne.
Ownership History
Date
Name
Owned For
Owner Type
Purchase Details
Closed on
May 23, 1989
Sold by
Ohare John R
Bought by
Mahoney John F
Current Estimated Value
Home Financials for this Owner
Home Financials are based on the most recent Mortgage that was taken out on this home.
Original Mortgage
$108,000
Interest Rate
10.97%
Mortgage Type
Purchase Money Mortgage
Create a Home Valuation Report for This Property
The Home Valuation Report is an in-depth analysis detailing your home's value as well as a comparison with similar homes in the area
Home Values in the Area
Average Home Value in this Area
Purchase History
| Date | Buyer | Sale Price | Title Company |
|---|---|---|---|
| Mahoney John F | $68,000 | -- | |
| Mahoney John F | $68,000 | -- |
Source: Public Records
Mortgage History
| Date | Status | Borrower | Loan Amount |
|---|---|---|---|
| Closed | Mahoney John F | $118,000 | |
| Closed | Mahoney John F | $108,000 |
Source: Public Records
Tax History Compared to Growth
Tax History
| Year | Tax Paid | Tax Assessment Tax Assessment Total Assessment is a certain percentage of the fair market value that is determined by local assessors to be the total taxable value of land and additions on the property. | Land | Improvement |
|---|---|---|---|---|
| 2025 | $3,560 | $455,800 | $181,700 | $274,100 |
| 2024 | $3,578 | $446,100 | $181,700 | $264,400 |
| 2023 | $3,478 | $394,800 | $160,800 | $234,000 |
| 2022 | $3,312 | $328,200 | $142,300 | $185,900 |
| 2021 | $3,219 | $298,900 | $129,500 | $169,400 |
| 2020 | $3,042 | $283,200 | $128,300 | $154,900 |
| 2019 | $2,905 | $276,400 | $128,300 | $148,100 |
| 2018 | $2,759 | $261,800 | $122,200 | $139,600 |
| 2017 | $2,617 | $254,100 | $121,100 | $133,000 |
| 2016 | $2,492 | $245,300 | $115,300 | $130,000 |
| 2015 | $2,470 | $245,300 | $115,300 | $130,000 |
Source: Public Records
Map
Nearby Homes
- 171 Bellavista Dr
- 34 Kenwood Rd
- 45 Kenwood Rd
- 254 Barlows Landing Rd
- 70 Wings Neck Rd
- 24 Richmond Rd
- 14 Navajo Rd
- 22 Nairn Rd
- 940 County Rd
- 709 County Rd
- 174 Barlows Landing Rd
- 48 Red Brook Harbor Rd
- 7 4th Ave
- 15 1st St
- 39 Bennets Neck Dr
- 89 Harbor Dr
- 3 Red Brook Pond Dr
- 940 County Rd
- 1094 County Rd
- 906 Shore Rd
- 2 Island Dr
- 33 Bellavista Dr
- 1 Winston Ave
- 31 Bellavista Dr
- 1 Windsong Cir
- 899 Shore Rd
- 35 Bellavista Dr
- 6 Island Dr
- 899 Shore Rd
- 29 Bellavista Dr
- 10 Virginia Rd
- 2 Windsong Cir
- 8 & 9 Bassetts Island
- 8 Island Dr
- 895 Shore Rd
- 895 Shore Rd Unit 1-3
- 894 Shore Rd
- 1 Island Dr
- 1 Bassetts Island