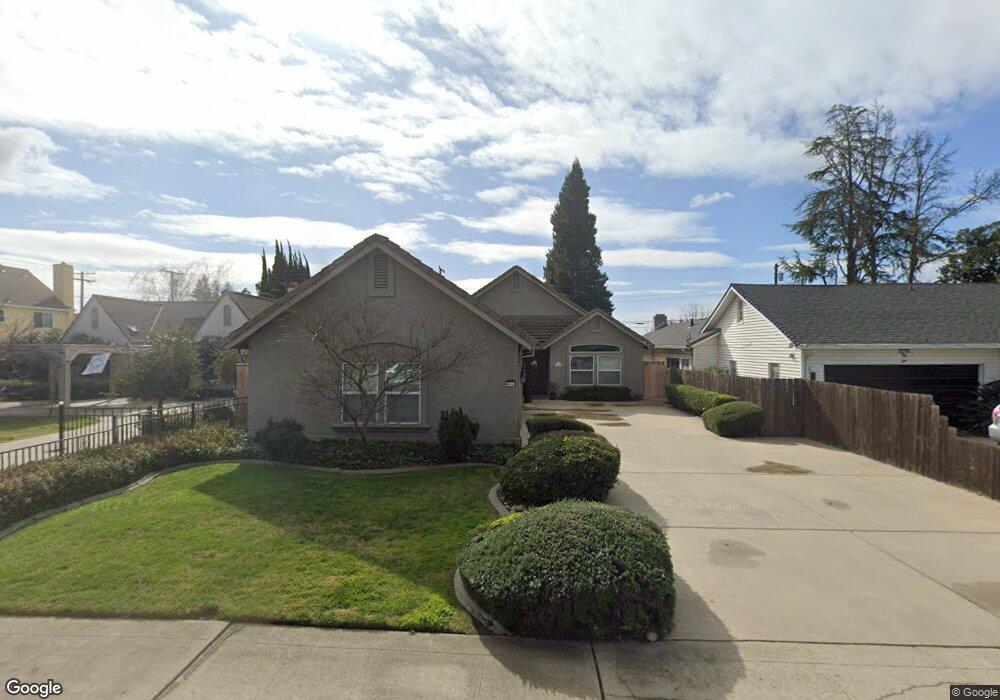
908 W Turner Rd Lodi, CA 95242
North Lodi NeighborhoodEstimated Value: $641,000 - $844,000
4
Beds
3
Baths
2,775
Sq Ft
$260/Sq Ft
Est. Value
About This Home
This home is located at 908 W Turner Rd, Lodi, CA 95242 and is currently estimated at $720,967, approximately $259 per square foot. 908 W Turner Rd is a home located in San Joaquin County with nearby schools including Lakewood Elementary School, Millswood Middle School, and Lodi High School.
Ownership History
Date
Name
Owned For
Owner Type
Purchase Details
Closed on
May 8, 2014
Sold by
Hanson Fay Ann
Bought by
Hanson Fay Ann
Current Estimated Value
Home Financials for this Owner
Home Financials are based on the most recent Mortgage that was taken out on this home.
Original Mortgage
$645,000
Outstanding Balance
$451,036
Interest Rate
2.27%
Mortgage Type
Reverse Mortgage Home Equity Conversion Mortgage
Estimated Equity
$269,931
Purchase Details
Closed on
Aug 22, 2011
Sold by
Hanson Faye
Bought by
Hanson Fay Ann and The Fay Ann Hanson Revocable T
Purchase Details
Closed on
Dec 16, 2002
Sold by
Hanson Rick and Hanson Fay
Bought by
Hanson Rick and Hanson Fay
Home Financials for this Owner
Home Financials are based on the most recent Mortgage that was taken out on this home.
Original Mortgage
$250,000
Interest Rate
6.03%
Purchase Details
Closed on
Feb 12, 2001
Sold by
Hernandez Ruben and Hernandez Linda Griffin
Bought by
Hanson Rick and Hanson Faye
Create a Home Valuation Report for This Property
The Home Valuation Report is an in-depth analysis detailing your home's value as well as a comparison with similar homes in the area
Home Values in the Area
Average Home Value in this Area
Purchase History
| Date | Buyer | Sale Price | Title Company |
|---|---|---|---|
| Hanson Fay Ann | -- | Placer Title Company | |
| Hanson Fay Ann | -- | None Available | |
| Hanson Faye | -- | None Available | |
| Hanson Rick | -- | Alliance Title Co | |
| Hanson Rick | $47,000 | Fidelity National Title Co |
Source: Public Records
Mortgage History
| Date | Status | Borrower | Loan Amount |
|---|---|---|---|
| Open | Hanson Fay Ann | $645,000 | |
| Previous Owner | Hanson Rick | $250,000 |
Source: Public Records
Tax History Compared to Growth
Tax History
| Year | Tax Paid | Tax Assessment Tax Assessment Total Assessment is a certain percentage of the fair market value that is determined by local assessors to be the total taxable value of land and additions on the property. | Land | Improvement |
|---|---|---|---|---|
| 2025 | $3,847 | $360,461 | $70,813 | $289,648 |
| 2024 | $3,741 | $353,394 | $69,425 | $283,969 |
| 2023 | $3,686 | $346,465 | $68,064 | $278,401 |
| 2022 | $3,602 | $339,673 | $66,730 | $272,943 |
| 2021 | $3,666 | $333,014 | $65,422 | $267,592 |
| 2020 | $3,570 | $329,601 | $64,752 | $264,849 |
| 2019 | $3,497 | $323,139 | $63,483 | $259,656 |
| 2018 | $3,446 | $316,804 | $62,239 | $254,565 |
| 2017 | $3,368 | $310,593 | $61,019 | $249,574 |
| 2016 | $3,156 | $304,505 | $59,823 | $244,682 |
| 2014 | $3,078 | $294,059 | $57,771 | $236,288 |
Source: Public Records
Map
Nearby Homes
- 834 N Ham Ln
- 744 W Turner Rd
- 839 Greenwood Dr
- 1114 Lakewood Dr
- 537 Palm Ave
- 400 N Pacific Ave
- 532 Louie Ave
- 1786 Le Bec Ct
- 327 Cross St
- 728 N Mills Ave
- 309 Forrest Ave
- 419 Matthew Plaza
- 625 N Church St Unit 8
- 625 N Church St Unit 5
- 2300 Eilers Ln
- 411 W Locust St
- 303 W Lockeford St
- 433 N Church St
- 2001 Jerry Ln
- 19 N Pinewood Ct
- 904 W Turner Rd
- 916 W Turner Rd
- 921 N Ham Ln
- 920 W Turner Rd
- 913 Lakehome Dr
- 919 Lakehome Dr
- 907 Lakehome Dr
- 925 Lakehome Dr
- 901 N Ham Ln
- 907 W Turner Rd
- 915 W Turner Rd
- 931 Lakehome Dr
- 921 W Turner Rd
- 928 W Turner Rd
- 1001 N Ham Ln
- 927 W Turner Rd
- 937 Lakehome Dr
- 920 N Ham Ln
- 910 N Ham Ln
- 906 Kirkwood Dr