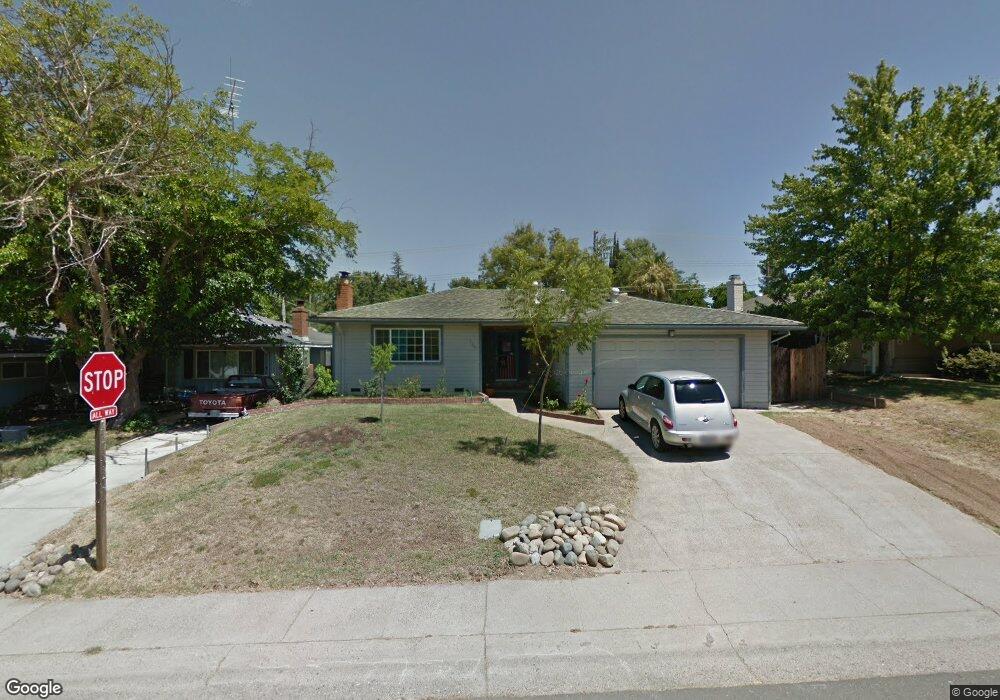
9081 Pershing Ave Orangevale, CA 95662
Estimated Value: $505,000 - $564,000
4
Beds
2
Baths
1,550
Sq Ft
$346/Sq Ft
Est. Value
About This Home
This home is located at 9081 Pershing Ave, Orangevale, CA 95662 and is currently estimated at $536,141, approximately $345 per square foot. 9081 Pershing Ave is a home located in Sacramento County with nearby schools including Pershing Elementary School, Andrew Carnegie Middle School, and Bella Vista High School.
Ownership History
Date
Name
Owned For
Owner Type
Purchase Details
Closed on
Aug 30, 2006
Sold by
Monteiro Renato S and Monteiro Deena L
Bought by
Nunn David L and Nunn Maria D
Current Estimated Value
Home Financials for this Owner
Home Financials are based on the most recent Mortgage that was taken out on this home.
Original Mortgage
$260,000
Outstanding Balance
$154,774
Interest Rate
6.51%
Mortgage Type
Purchase Money Mortgage
Estimated Equity
$381,367
Purchase Details
Closed on
Aug 30, 1995
Sold by
Burtis Janelle M and Burtis William F
Bought by
Monteiro Renato S and Monteiro Deena L
Home Financials for this Owner
Home Financials are based on the most recent Mortgage that was taken out on this home.
Original Mortgage
$107,800
Interest Rate
7.63%
Create a Home Valuation Report for This Property
The Home Valuation Report is an in-depth analysis detailing your home's value as well as a comparison with similar homes in the area
Home Values in the Area
Average Home Value in this Area
Purchase History
| Date | Buyer | Sale Price | Title Company |
|---|---|---|---|
| Nunn David L | $360,000 | Stewart Title Of Sacramento | |
| Monteiro Renato S | $113,500 | Fidelity National Title |
Source: Public Records
Mortgage History
| Date | Status | Borrower | Loan Amount |
|---|---|---|---|
| Open | Nunn David L | $260,000 | |
| Previous Owner | Monteiro Renato S | $107,800 |
Source: Public Records
Tax History
| Year | Tax Paid | Tax Assessment Tax Assessment Total Assessment is a certain percentage of the fair market value that is determined by local assessors to be the total taxable value of land and additions on the property. | Land | Improvement |
|---|---|---|---|---|
| 2025 | $7,398 | $482,307 | $162,776 | $319,531 |
| 2024 | $7,398 | $472,851 | $159,585 | $313,266 |
| 2023 | $7,254 | $463,580 | $156,456 | $307,124 |
| 2022 | $7,223 | $454,491 | $153,389 | $301,102 |
| 2021 | $5,128 | $425,018 | $121,433 | $303,585 |
| 2020 | $4,476 | $374,466 | $106,990 | $267,476 |
| 2019 | $4,300 | $360,064 | $102,875 | $257,189 |
| 2018 | $4,167 | $346,217 | $98,919 | $247,298 |
| 2017 | $3,931 | $323,568 | $92,448 | $231,120 |
| 2016 | $3,467 | $299,600 | $85,600 | $214,000 |
| 2015 | $3,232 | $327,107 | $110,398 | $216,709 |
| 2014 | $3,700 | $320,693 | $108,233 | $212,460 |
Source: Public Records
Map
Nearby Homes
- 9100 Sutton Way
- 5543 Bellingham Way
- 9237 Madison Ave
- 5817 Husker St
- 5607 Walnut Ave Unit 10
- 9160 Madison Ave Unit 68
- 9160 Madison Ave Unit 103
- 6217 Green Eyes Way
- 5326 Flyway Dr
- 9200 Madison Ave Unit 196
- 9200 Madison Ave Unit 151
- 8855 Glori Dawn Dr
- 5630 Boltres St
- 8832 Canarsie Ave
- 9017 Phoenix Ave
- 8805 Jonnie Way
- 5947 Main Ave Unit A
- 9348 Blue Oak Dr
- 9350 River Oaks Ln
- 5943 Main Ave Unit A
- 9085 Pershing Ave
- 9077 Pershing Ave
- 9073 Pershing Ave
- 5751 Filbert Ave
- 5757 Filbert Ave
- 5803 Filbert Ave
- 5805 Filbert Ave
- 5722 Skyridge Dr
- 9069 Pershing Ave
- 9088 Pershing Ave
- 5807 Filbert Ave
- 5721 Skyridge Dr
- 5716 Skyridge Dr
- 9065 Pershing Ave
- 4943 Filbert Ave
- 9092 Pershing Ave
- 5809 Filbert Ave
- 5717 Skyridge Dr
- 9096 Pershing Ave
- 5821 Filbert Ave
Your Personal Tour Guide
Ask me questions while you tour the home.