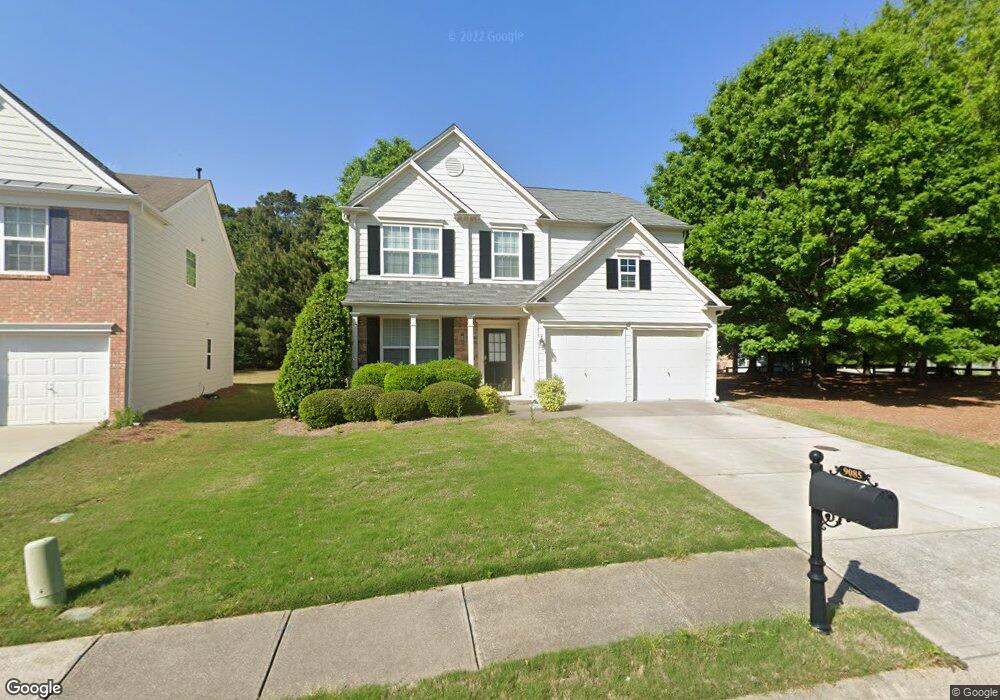
9085 Friarbridge Dr Suwanee, GA 30024
Estimated Value: $513,000 - $552,000
3
Beds
3
Baths
1,952
Sq Ft
$273/Sq Ft
Est. Value
About This Home
This home is located at 9085 Friarbridge Dr, Suwanee, GA 30024 and is currently estimated at $532,598, approximately $272 per square foot. 9085 Friarbridge Dr is a home located in Forsyth County with nearby schools including Johns Creek Elementary School, Riverwatch Middle School, and Lambert High School.
Ownership History
Date
Name
Owned For
Owner Type
Purchase Details
Closed on
Dec 20, 2019
Sold by
Ni Zhiping
Bought by
Luo Yuehong
Current Estimated Value
Purchase Details
Closed on
Mar 3, 2010
Sold by
Citibank Na Lmt 2006 & 4
Bought by
Ni Zhiphing and Ni Yuexian
Purchase Details
Closed on
Sep 1, 2009
Sold by
Ward Judy
Bought by
Citibank Na Lmt 2006 & 4 Trust F
Purchase Details
Closed on
Feb 26, 2004
Sold by
Pulte Home Corp
Bought by
Ward Judy D
Home Financials for this Owner
Home Financials are based on the most recent Mortgage that was taken out on this home.
Original Mortgage
$38,700
Interest Rate
5.68%
Mortgage Type
New Conventional
Create a Home Valuation Report for This Property
The Home Valuation Report is an in-depth analysis detailing your home's value as well as a comparison with similar homes in the area
Home Values in the Area
Average Home Value in this Area
Purchase History
| Date | Buyer | Sale Price | Title Company |
|---|---|---|---|
| Luo Yuehong | $283,000 | -- | |
| Ni Zhiphing | $158,000 | -- | |
| Citibank Na Lmt 2006 & 4 Trust F | $177,614 | -- | |
| Ward Judy D | $193,700 | -- |
Source: Public Records
Mortgage History
| Date | Status | Borrower | Loan Amount |
|---|---|---|---|
| Previous Owner | Ward Judy D | $38,700 |
Source: Public Records
Tax History Compared to Growth
Tax History
| Year | Tax Paid | Tax Assessment Tax Assessment Total Assessment is a certain percentage of the fair market value that is determined by local assessors to be the total taxable value of land and additions on the property. | Land | Improvement |
|---|---|---|---|---|
| 2025 | $4,928 | $226,016 | $78,000 | $148,016 |
| 2024 | $4,928 | $200,944 | $66,000 | $134,944 |
| 2023 | $4,602 | $186,984 | $62,000 | $124,984 |
| 2022 | $4,248 | $121,300 | $38,000 | $83,300 |
| 2021 | $3,350 | $121,300 | $38,000 | $83,300 |
| 2020 | $3,126 | $113,200 | $38,200 | $75,000 |
| 2019 | $3,113 | $112,568 | $38,000 | $74,568 |
| 2018 | $3,049 | $110,264 | $38,000 | $72,264 |
| 2017 | $2,759 | $99,412 | $38,000 | $61,412 |
| 2016 | $2,537 | $91,412 | $30,000 | $61,412 |
| 2015 | $2,321 | $83,492 | $30,000 | $53,492 |
| 2014 | $1,968 | $74,348 | $30,000 | $44,348 |
Source: Public Records
Map
Nearby Homes
- 9020 Friarbridge Dr
- 8965 Friarbridge Dr Unit 1B
- 6745 Fairfield Trace
- 135 Splinter Ct
- 7950 Laurel Creek Dr
- 6555 Fairfield Trace
- 764 Morganton Dr
- 8055 Cavendish Place
- 8935 Muirfield Ct
- 6580 Marlowe Glen Way
- 555 Midhurst Place
- 790 Potters Bar Ln
- 8630 Moor Park Run
- 10950 Regal Forest Dr
- 4844 Elkhorn Hill Dr
- 5750 Jockey Walk
- 4891 Tarry Post Ln
- 5745 Overlook Station Dr
- 8320 Kenningston Way
- 9075 Friarbridge Dr
- 9075R Friarbridge Dr
- 9065 Friarbridge Dr
- 540 Kemp Rd
- 9055 Friarbridge Dr
- 9080 Friarbridge Dr
- 9070 Friarbridge Dr
- 9090 Friarbridge Dr
- 9045 Friarbridge Dr Unit 1B
- 9045 Friarbridge Dr
- 9050 Friarbridge Dr Unit 1B
- 9110 Friarbridge Dr
- 9125 Friarbridge Dr
- 9035 Friarbridge Dr
- 9120 Friarbridge Dr
- 8985 Ruel Ln
- 8995 Ruel Ln
- 3680 Iron Horse Dr
- 9030 Friarbridge Dr
- 9135 Friarbridge Dr