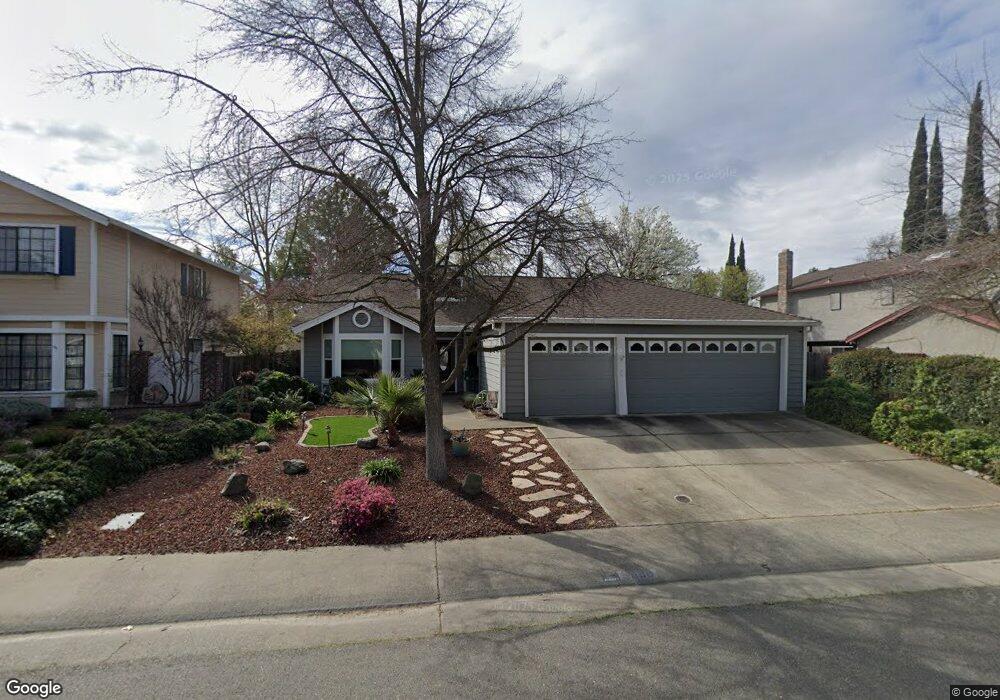
9088 Drake Meadow Way Elk Grove, CA 95624
South East Elk Grove NeighborhoodEstimated Value: $538,000 - $628,000
4
Beds
2
Baths
2,026
Sq Ft
$290/Sq Ft
Est. Value
About This Home
This home is located at 9088 Drake Meadow Way, Elk Grove, CA 95624 and is currently estimated at $587,135, approximately $289 per square foot. 9088 Drake Meadow Way is a home located in Sacramento County with nearby schools including Florence Markofer Elementary School, Joseph Kerr Middle School, and Elk Grove High School.
Ownership History
Date
Name
Owned For
Owner Type
Purchase Details
Closed on
Jun 20, 2017
Sold by
Frost Goodwin Michael John and Frost Goodwin Kathleen
Bought by
Frost Goodwin Michael John and Frost Goodwin Kathleen
Current Estimated Value
Purchase Details
Closed on
Apr 25, 2013
Sold by
Goodwin Kathleen and Frost Kathleen Diane
Bought by
Goodwin Michael J and Goodwin Kathleen
Home Financials for this Owner
Home Financials are based on the most recent Mortgage that was taken out on this home.
Original Mortgage
$171,700
Interest Rate
3.6%
Mortgage Type
New Conventional
Purchase Details
Closed on
Dec 13, 2002
Sold by
Arjona Jose Manuel
Bought by
Frost Kathleen Diane
Home Financials for this Owner
Home Financials are based on the most recent Mortgage that was taken out on this home.
Original Mortgage
$117,500
Interest Rate
6.03%
Create a Home Valuation Report for This Property
The Home Valuation Report is an in-depth analysis detailing your home's value as well as a comparison with similar homes in the area
Home Values in the Area
Average Home Value in this Area
Purchase History
| Date | Buyer | Sale Price | Title Company |
|---|---|---|---|
| Frost Goodwin Michael John | -- | None Available | |
| Frost Goodwin Michael John | -- | None Available | |
| Goodwin Michael J | -- | Fidelity National Title Co | |
| Frost Kathleen Diane | -- | First American Title Ins Co |
Source: Public Records
Mortgage History
| Date | Status | Borrower | Loan Amount |
|---|---|---|---|
| Closed | Goodwin Michael J | $171,700 | |
| Closed | Frost Kathleen Diane | $117,500 |
Source: Public Records
Tax History Compared to Growth
Tax History
| Year | Tax Paid | Tax Assessment Tax Assessment Total Assessment is a certain percentage of the fair market value that is determined by local assessors to be the total taxable value of land and additions on the property. | Land | Improvement |
|---|---|---|---|---|
| 2025 | $2,619 | $241,887 | $57,405 | $184,482 |
| 2024 | $2,619 | $237,145 | $56,280 | $180,865 |
| 2023 | $2,550 | $232,496 | $55,177 | $177,319 |
| 2022 | $2,501 | $227,939 | $54,096 | $173,843 |
| 2021 | $2,464 | $223,471 | $53,036 | $170,435 |
| 2020 | $2,430 | $221,181 | $52,493 | $168,688 |
| 2019 | $2,382 | $216,845 | $51,464 | $165,381 |
| 2018 | $2,316 | $212,594 | $50,455 | $162,139 |
| 2017 | $2,273 | $208,426 | $49,466 | $158,960 |
| 2016 | $2,157 | $204,341 | $48,497 | $155,844 |
| 2015 | $2,116 | $201,273 | $47,769 | $153,504 |
| 2014 | $2,079 | $197,332 | $46,834 | $150,498 |
Source: Public Records
Map
Nearby Homes
- 9706 Parktree Way
- 9648 La Nuez Dr
- 9684 Gage St
- 8977 E Valley Dr
- 9552 Porto Rosa Dr
- 10112 Nebbiolo Ct
- 10121 Nebbiolo Ct
- 9669 Anton Oaks Way
- 9550 Colton Ave
- 9523 Sauterne Way
- 25 Calle Susana
- 30 Calle Susana
- 15 Calle Margarita
- 9497 Sara St
- 9720 Palazzo Ct
- 0 E Stockton Blvd Unit ML82022099
- 135 Calle Maria
- 97 Calle Anta
- 10409 Charles Morris Way
- 8770 Superb Cir
- 9092 Drake Meadow Way
- 9084 Drake Meadow Way
- 9080 Drake Meadow Way
- 9094 Drake Meadow Way
- 9089 Drake Meadow Way
- 9878 Falcon Meadow Dr
- 9085 Drake Meadow Way
- 9077 Lismore Dr
- 9081 Lismore Dr
- 9076 Drake Meadow Way
- 9073 Lismore Dr
- 9081 Drake Meadow Way
- 9085 Lismore Dr
- 9874 Falcon Meadow Dr
- 9912 Falcon Meadow Dr
- 9069 Lismore Dr
- 9077 Drake Meadow Way
- 9072 Drake Meadow Way
- 9870 Falcon Meadow Dr
- 9065 Lismore Dr