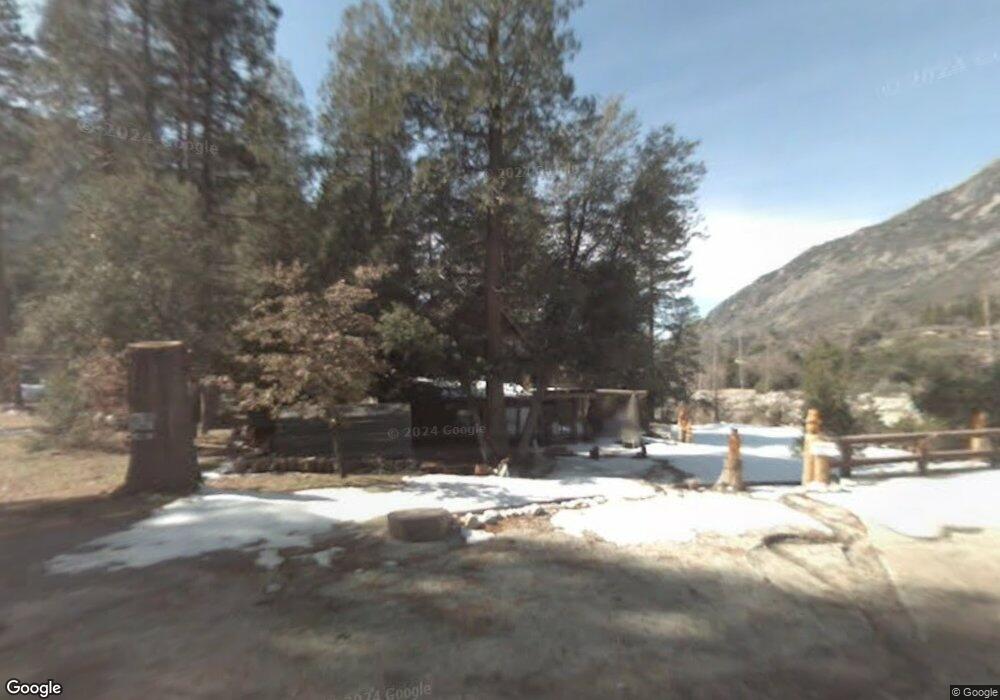
9088 Torrey Pines Rd Forest Falls, CA 92339
Estimated Value: $343,000 - $510,000
3
Beds
2
Baths
1,800
Sq Ft
$234/Sq Ft
Est. Value
About This Home
This home is located at 9088 Torrey Pines Rd, Forest Falls, CA 92339 and is currently estimated at $421,253, approximately $234 per square foot. 9088 Torrey Pines Rd is a home located in San Bernardino County with nearby schools including Morongo Valley Elementary School, La Contenta Middle School, and Yucca Valley High School.
Ownership History
Date
Name
Owned For
Owner Type
Purchase Details
Closed on
Jan 22, 2010
Sold by
Deutsche Bank National Trust Company
Bought by
Covey Anthony J and Covey Caren F
Current Estimated Value
Purchase Details
Closed on
Sep 30, 2009
Sold by
Lugo Jose A
Bought by
Deutsche Bank National Trust Company
Purchase Details
Closed on
Sep 14, 2005
Sold by
Swan Thor O
Bought by
Lugo Jose A and Lugo Perla M
Home Financials for this Owner
Home Financials are based on the most recent Mortgage that was taken out on this home.
Original Mortgage
$249,000
Interest Rate
5.75%
Mortgage Type
Purchase Money Mortgage
Purchase Details
Closed on
Jan 13, 1998
Sold by
Big Pine Tract Improvement & Water Assn
Bought by
Swan Thor O and Swan Bonnie D
Home Financials for this Owner
Home Financials are based on the most recent Mortgage that was taken out on this home.
Original Mortgage
$116,200
Interest Rate
7.07%
Create a Home Valuation Report for This Property
The Home Valuation Report is an in-depth analysis detailing your home's value as well as a comparison with similar homes in the area
Home Values in the Area
Average Home Value in this Area
Purchase History
| Date | Buyer | Sale Price | Title Company |
|---|---|---|---|
| Covey Anthony J | $169,000 | Chicago Title Company | |
| Deutsche Bank National Trust Company | $131,016 | Stewart Title Co Glendale | |
| Lugo Jose A | $415,000 | Commonwealth Land Title Co | |
| Swan Thor O | -- | Chicago Title |
Source: Public Records
Mortgage History
| Date | Status | Borrower | Loan Amount |
|---|---|---|---|
| Previous Owner | Lugo Jose A | $249,000 | |
| Previous Owner | Swan Thor O | $116,200 |
Source: Public Records
Tax History Compared to Growth
Tax History
| Year | Tax Paid | Tax Assessment Tax Assessment Total Assessment is a certain percentage of the fair market value that is determined by local assessors to be the total taxable value of land and additions on the property. | Land | Improvement |
|---|---|---|---|---|
| 2025 | $2,462 | $218,150 | $64,542 | $153,608 |
| 2024 | $2,462 | $213,872 | $63,276 | $150,596 |
| 2023 | $2,437 | $209,678 | $62,035 | $147,643 |
| 2022 | $2,380 | $205,567 | $60,819 | $144,748 |
| 2021 | $2,426 | $201,536 | $59,626 | $141,910 |
| 2020 | $2,361 | $199,470 | $59,015 | $140,455 |
| 2019 | $2,297 | $195,559 | $57,858 | $137,701 |
| 2018 | $2,065 | $191,725 | $56,724 | $135,001 |
| 2017 | $2,051 | $187,966 | $55,612 | $132,354 |
| 2016 | $2,011 | $184,281 | $54,522 | $129,759 |
| 2015 | $1,993 | $181,513 | $53,703 | $127,810 |
| 2014 | $1,958 | $177,957 | $52,651 | $125,306 |
Source: Public Records
Map
Nearby Homes
- 9112 Torrey Pines Rd
- 40180 Valley of The Falls Dr
- 9165 Coffey Rd
- 41424 Valley of The Falls Dr
- 9226 Wood Rd
- 9269 Wood Rd
- 39722 Valley of The Falls Dr
- 40914 Oak Dr
- 39627 Prospect Dr
- 0 Fir Dr
- 0 Cedar Dr Unit IG25157154
- 41045 Valley of The Falls Dr
- 41062 Pine Dr
- 41061 Pine Dr
- 9323 Cedar Dr
- 39505 Canyon Dr
- 39480 Prospect Dr
- 41099 Valley of The Falls Dr
- 39455 Prospect Dr
- 9410 Canyon Dr
- 9108 Torrey Pines Rd
- 9100 Torrey Pines Rd
- 9128 Torrey Pines Rd
- 9089 Torrey Pines Rd
- 9099 Torrey Pines Rd Unit 24
- 9111 Torrey Pines Rd
- 9120 Torrey Pines Rd
- 40330 Vof Dr Unit 26
- 40330 Valley of The Falls Dr
- 40262 May Rd
- 40262 May Rd Unit 15
- 40256 May Rd
- 40360 Valley of The Falls Dr
- 40240 May Rd
- 40260 Valley of The Falls Dr
- 40335 Valley of The Falls Dr
- 40220 May Rd
- 40341 Valley of The Falls Dr
- 40380 Valley of The Falls Dr
- 40323 Valley of The Falls Dr