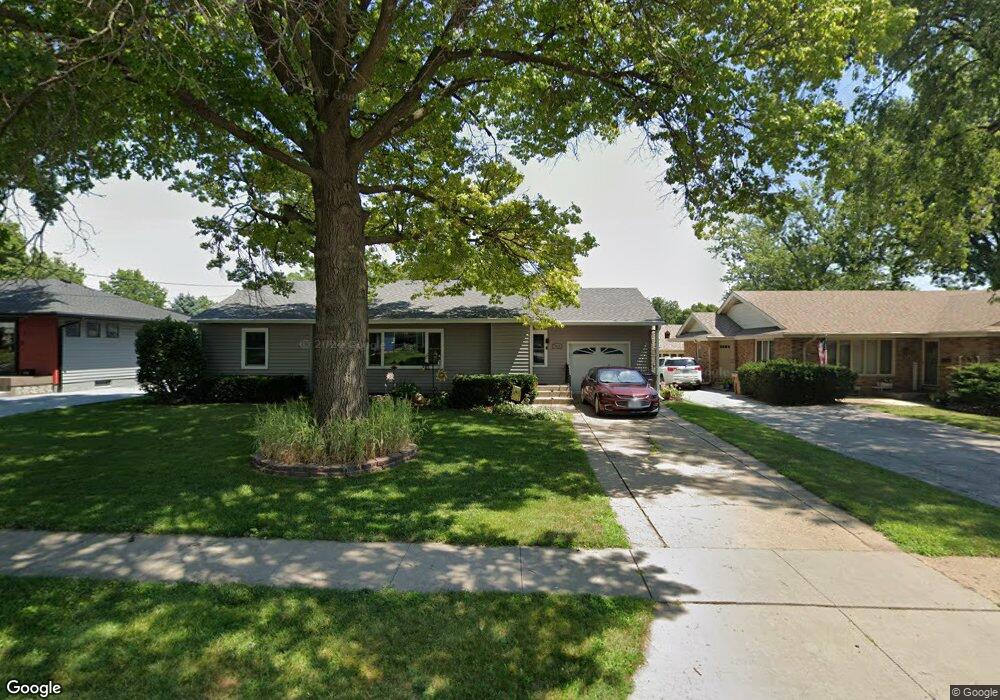
909 15th St West Des Moines, IA 50265
Estimated Value: $269,564 - $301,000
3
Beds
2
Baths
1,631
Sq Ft
$175/Sq Ft
Est. Value
About This Home
This home is located at 909 15th St, West Des Moines, IA 50265 and is currently estimated at $284,891, approximately $174 per square foot. 909 15th St is a home located in Polk County with nearby schools including Hillside Elementary School, Stilwell Junior High School, and Valley Southwoods Freshman High School.
Ownership History
Date
Name
Owned For
Owner Type
Purchase Details
Closed on
May 4, 2016
Sold by
Benson Linda M and Benson Ronald
Bought by
Benson Rodney L and Benson Robin
Current Estimated Value
Home Financials for this Owner
Home Financials are based on the most recent Mortgage that was taken out on this home.
Original Mortgage
$140,000
Outstanding Balance
$110,892
Interest Rate
3.59%
Mortgage Type
New Conventional
Estimated Equity
$173,999
Purchase Details
Closed on
May 14, 2008
Sold by
Earp Daniel P
Bought by
Benson Rodney L and Benson Linda M
Home Financials for this Owner
Home Financials are based on the most recent Mortgage that was taken out on this home.
Original Mortgage
$151,128
Interest Rate
5.87%
Mortgage Type
FHA
Purchase Details
Closed on
Apr 4, 2006
Sold by
Earp Harold
Bought by
Earp Harold
Create a Home Valuation Report for This Property
The Home Valuation Report is an in-depth analysis detailing your home's value as well as a comparison with similar homes in the area
Home Values in the Area
Average Home Value in this Area
Purchase History
| Date | Buyer | Sale Price | Title Company |
|---|---|---|---|
| Benson Rodney L | -- | None Available | |
| Benson Rodney L | $153,000 | Itc | |
| Earp Harold | -- | None Available |
Source: Public Records
Mortgage History
| Date | Status | Borrower | Loan Amount |
|---|---|---|---|
| Open | Benson Rodney L | $140,000 | |
| Previous Owner | Benson Rodney L | $151,128 |
Source: Public Records
Tax History Compared to Growth
Tax History
| Year | Tax Paid | Tax Assessment Tax Assessment Total Assessment is a certain percentage of the fair market value that is determined by local assessors to be the total taxable value of land and additions on the property. | Land | Improvement |
|---|---|---|---|---|
| 2025 | $3,742 | $265,300 | $66,200 | $199,100 |
| 2024 | $3,742 | $236,100 | $58,000 | $178,100 |
| 2023 | $3,702 | $236,100 | $58,000 | $178,100 |
| 2022 | $3,658 | $191,700 | $48,700 | $143,000 |
| 2021 | $3,456 | $191,700 | $48,700 | $143,000 |
| 2020 | $3,404 | $172,300 | $43,800 | $128,500 |
| 2019 | $3,244 | $172,300 | $43,800 | $128,500 |
| 2018 | $3,252 | $158,400 | $39,300 | $119,100 |
| 2017 | $3,134 | $158,400 | $39,300 | $119,100 |
| 2016 | $3,066 | $148,300 | $36,400 | $111,900 |
| 2015 | $3,066 | $148,300 | $36,400 | $111,900 |
| 2014 | $3,056 | $146,100 | $35,200 | $110,900 |
Source: Public Records
Map
Nearby Homes