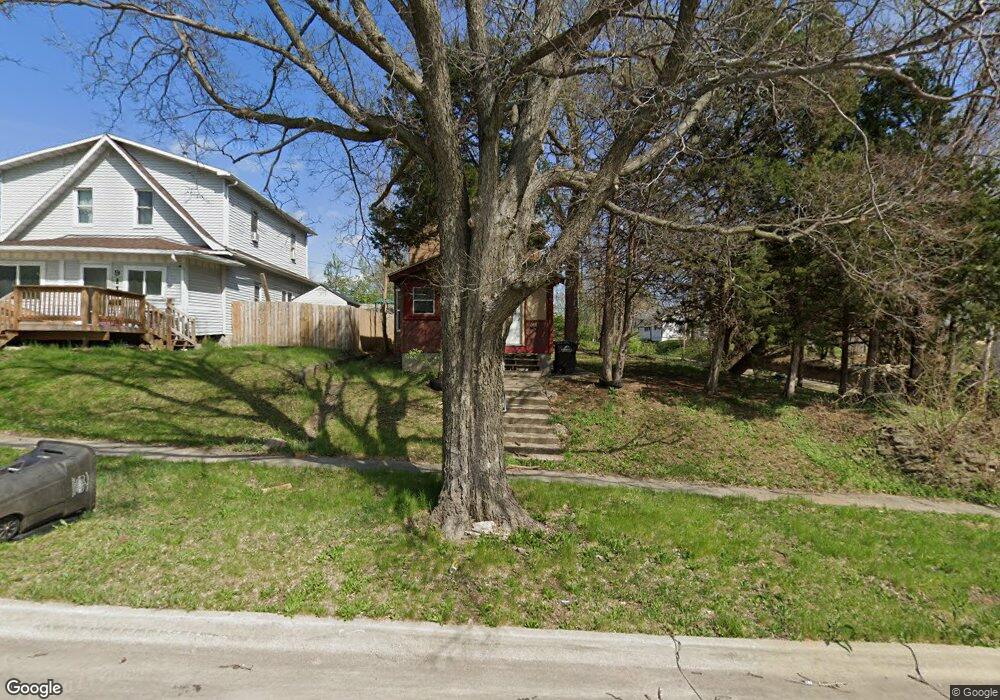
909 26th St Des Moines, IA 50312
Woodland Heights NeighborhoodEstimated Value: $164,000 - $215,000
2
Beds
2
Baths
1,152
Sq Ft
$157/Sq Ft
Est. Value
About This Home
This home is located at 909 26th St, Des Moines, IA 50312 and is currently estimated at $180,668, approximately $156 per square foot. 909 26th St is a home located in Polk County with nearby schools including Greenwood Elementary School and Roosevelt High School.
Ownership History
Date
Name
Owned For
Owner Type
Purchase Details
Closed on
Feb 28, 2022
Sold by
Guidner Properties Llc
Bought by
Sol Azul Group Llc
Current Estimated Value
Purchase Details
Closed on
Jul 28, 2021
Sold by
Estate Of Garhardt J Gary Oeth
Bought by
Guidner Properties Llc
Purchase Details
Closed on
Dec 17, 2019
Sold by
Oeth Suzanne
Bought by
Weidner Oeth Patricia and Estate Of Gary Oeth
Purchase Details
Closed on
Feb 27, 1998
Sold by
Hart Alice M
Bought by
Oeth Gary J and Oeth Suzanne
Create a Home Valuation Report for This Property
The Home Valuation Report is an in-depth analysis detailing your home's value as well as a comparison with similar homes in the area
Home Values in the Area
Average Home Value in this Area
Purchase History
| Date | Buyer | Sale Price | Title Company |
|---|---|---|---|
| Sol Azul Group Llc | -- | None Listed On Document | |
| Guidner Properties Llc | -- | None Available | |
| Weidner Oeth Patricia | -- | None Available | |
| Oeth Gary J | $22,500 | -- |
Source: Public Records
Tax History Compared to Growth
Tax History
| Year | Tax Paid | Tax Assessment Tax Assessment Total Assessment is a certain percentage of the fair market value that is determined by local assessors to be the total taxable value of land and additions on the property. | Land | Improvement |
|---|---|---|---|---|
| 2025 | $2,430 | $140,200 | $34,200 | $106,000 |
| 2024 | $2,430 | $123,500 | $30,100 | $93,400 |
| 2023 | $2,324 | $123,500 | $30,100 | $93,400 |
| 2022 | $2,306 | $98,600 | $24,500 | $74,100 |
| 2021 | $2,178 | $98,600 | $24,500 | $74,100 |
| 2020 | $2,264 | $87,300 | $21,900 | $65,400 |
| 2019 | $2,080 | $87,300 | $21,900 | $65,400 |
| 2018 | $2,060 | $77,400 | $19,100 | $58,300 |
| 2017 | $1,982 | $77,400 | $19,100 | $58,300 |
| 2016 | $1,932 | $73,300 | $18,000 | $55,300 |
| 2015 | $1,932 | $73,300 | $18,000 | $55,300 |
| 2014 | $1,762 | $66,300 | $16,200 | $50,100 |
Source: Public Records
Map
Nearby Homes