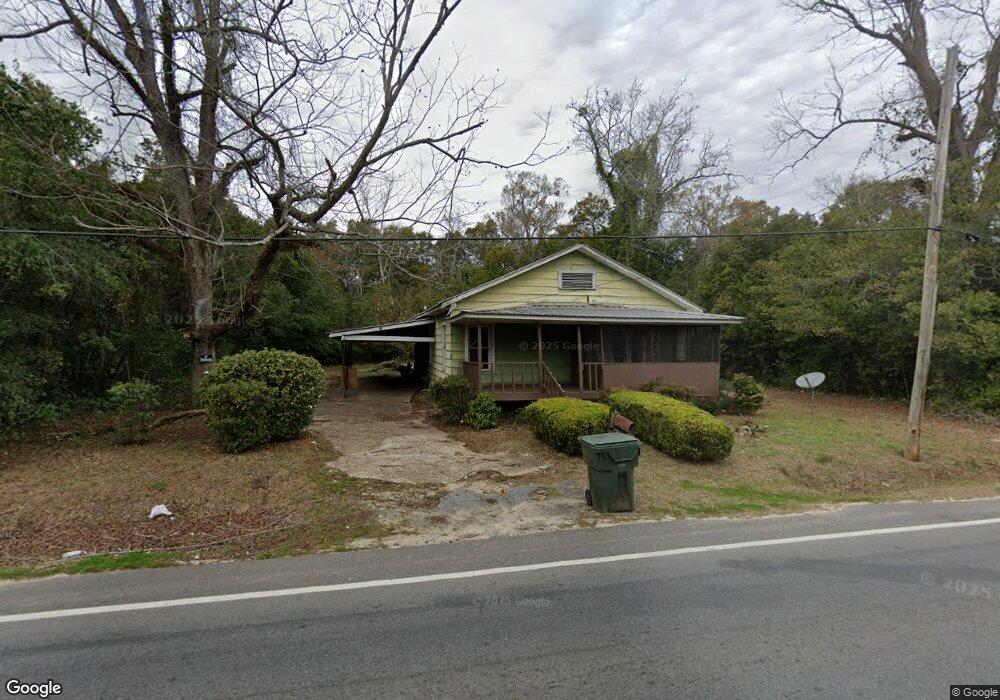
909 Albany Rd Bainbridge, GA 39817
Estimated Value: $61,495 - $190,000
--
Bed
--
Bath
1,276
Sq Ft
$115/Sq Ft
Est. Value
About This Home
This home is located at 909 Albany Rd, Bainbridge, GA 39817 and is currently estimated at $146,498, approximately $114 per square foot. 909 Albany Rd is a home with nearby schools including Bainbridge High School and Grace Christian Academy.
Ownership History
Date
Name
Owned For
Owner Type
Purchase Details
Closed on
Sep 27, 2018
Sold by
Harrison S D
Bought by
Kintchen Robert and Kintchen Goldie
Current Estimated Value
Create a Home Valuation Report for This Property
The Home Valuation Report is an in-depth analysis detailing your home's value as well as a comparison with similar homes in the area
Home Values in the Area
Average Home Value in this Area
Purchase History
| Date | Buyer | Sale Price | Title Company |
|---|---|---|---|
| Kintchen Robert | -- | -- |
Source: Public Records
Tax History Compared to Growth
Tax History
| Year | Tax Paid | Tax Assessment Tax Assessment Total Assessment is a certain percentage of the fair market value that is determined by local assessors to be the total taxable value of land and additions on the property. | Land | Improvement |
|---|---|---|---|---|
| 2024 | $520 | $16,442 | $1,272 | $15,170 |
| 2023 | $518 | $16,442 | $1,272 | $15,170 |
| 2022 | $511 | $16,575 | $1,272 | $15,303 |
| 2021 | $464 | $14,663 | $1,272 | $13,391 |
| 2020 | $426 | $12,748 | $1,272 | $11,476 |
| 2019 | $424 | $12,201 | $1,272 | $10,929 |
| 2018 | $419 | $12,201 | $1,272 | $10,929 |
| 2017 | $365 | $10,431 | $1,254 | $9,177 |
| 2016 | $740 | $10,432 | $1,254 | $9,177 |
| 2015 | $375 | $10,432 | $1,254 | $9,177 |
| 2014 | $348 | $10,432 | $1,254 | $9,177 |
| 2013 | -- | $10,431 | $1,254 | $9,177 |
Source: Public Records
Map
Nearby Homes
- 836 Cooper St
- 705 N Lamar St
- 927 5th Ave
- 411 Independent St
- 502 Planter St
- 435 E Broughton St
- 1020 E Water St
- 418 E Broughton St
- 302 E Water St
- Dell Rd
- 640 E Shotwell St
- 632 E Shotwell St
- 1204 E Water St
- 423 E Shotwell St
- 906 E Sharpe St
- Lot 7 Easy Dr
- 401 S Sims St
- 249 Meredith Dr
- 245 Meredith Dr
- Lot 3 Mountain View Way