909 Alvarado Rd Berkeley, CA 94705
Claremont Hills NeighborhoodEstimated Value: $2,146,165 - $2,320,000
5
Beds
4
Baths
3,705
Sq Ft
$602/Sq Ft
Est. Value
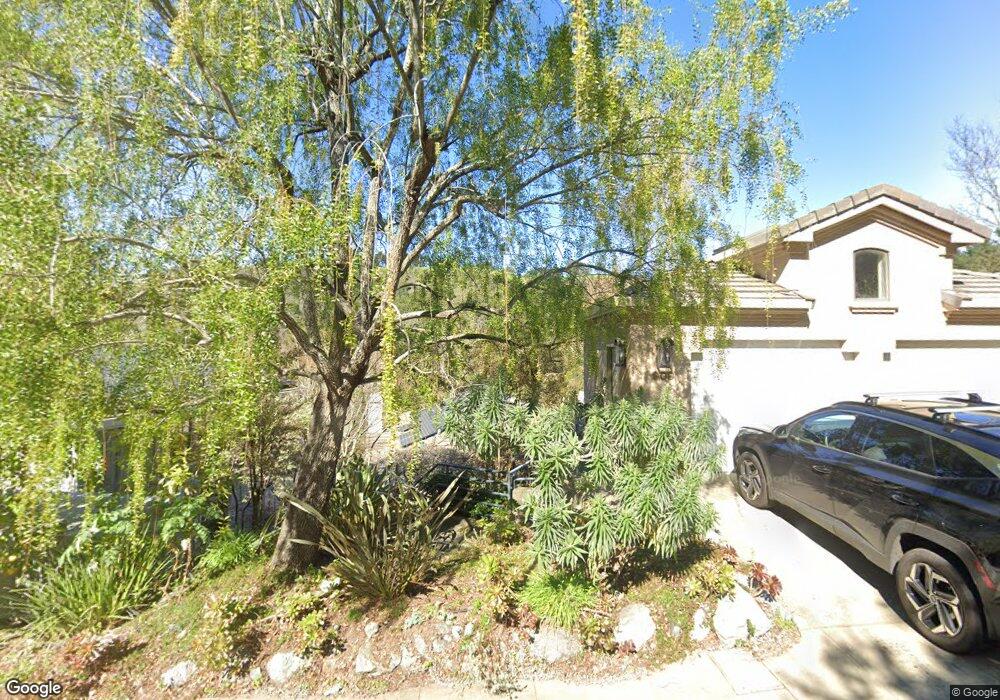
About This Home
This home is located at 909 Alvarado Rd, Berkeley, CA 94705 and is currently estimated at $2,229,791, approximately $601 per square foot. 909 Alvarado Rd is a home located in Alameda County with nearby schools including Chabot Elementary School, Thornhill Elementary School, and Claremont Middle School.
Ownership History
Date
Name
Owned For
Owner Type
Purchase Details
Closed on
Feb 4, 2015
Sold by
Wincorn Warren C and Wincorn Peggy B
Bought by
Tingley Whittemore G and Tingley Debora W
Current Estimated Value
Home Financials for this Owner
Home Financials are based on the most recent Mortgage that was taken out on this home.
Original Mortgage
$1,196,250
Outstanding Balance
$912,844
Interest Rate
3.66%
Mortgage Type
New Conventional
Estimated Equity
$1,316,947
Create a Home Valuation Report for This Property
The Home Valuation Report is an in-depth analysis detailing your home's value as well as a comparison with similar homes in the area
Home Values in the Area
Average Home Value in this Area
Purchase History
| Date | Buyer | Sale Price | Title Company |
|---|---|---|---|
| Tingley Whittemore G | $1,595,000 | Fidelity National Title Co |
Source: Public Records
Mortgage History
| Date | Status | Borrower | Loan Amount |
|---|---|---|---|
| Open | Tingley Whittemore G | $1,196,250 |
Source: Public Records
Tax History Compared to Growth
Tax History
| Year | Tax Paid | Tax Assessment Tax Assessment Total Assessment is a certain percentage of the fair market value that is determined by local assessors to be the total taxable value of land and additions on the property. | Land | Improvement |
|---|---|---|---|---|
| 2025 | $25,615 | $1,916,886 | $575,066 | $1,341,820 |
| 2024 | $25,615 | $1,879,308 | $563,792 | $1,315,516 |
| 2023 | $27,155 | $1,842,463 | $552,739 | $1,289,724 |
| 2022 | $26,612 | $1,806,337 | $541,901 | $1,264,436 |
| 2021 | $25,817 | $1,770,927 | $531,278 | $1,239,649 |
| 2020 | $25,540 | $1,752,777 | $525,833 | $1,226,944 |
| 2019 | $24,816 | $1,718,420 | $515,526 | $1,202,894 |
| 2018 | $24,293 | $1,684,734 | $505,420 | $1,179,314 |
| 2017 | $23,454 | $1,651,701 | $495,510 | $1,156,191 |
| 2016 | $23,084 | $1,619,323 | $485,797 | $1,133,526 |
| 2015 | $5,224 | $314,930 | $70,985 | $243,945 |
| 2014 | $5,183 | $308,763 | $69,595 | $239,168 |
Source: Public Records
Map
Nearby Homes
- 8018 Alvarado Rd
- 142 Gravatt Dr
- 7723 Claremont Ave
- 0 Dartmouth Dr
- 7361 Claremont Ave
- 25 Dartmouth Dr
- 1215 Alvarado Rd
- 1383 Alvarado Rd
- 305 The Uplands
- 0 Tunnel Rd
- 1522 Grand View Dr
- 7041 Devon Way
- 1881 Grand View Dr
- 0 Buckingham Blvd Unit 41115384
- 7003 Buckingham Blvd
- 64 Schooner Hill
- 2964 Magnolia St
- 39 Starview Dr
- 60 Panoramic Way
- 917 Alvarado Rd
- 901 Alvarado Rd
- 921 Alvarado Rd
- 933 Alvarado Rd
- 910 Alvarado Rd
- 945 Alvarado Rd
- 870 Alvarado Rd
- 940 Alvarado Rd
- 900 Alvarado Rd
- 951 Alvarado Rd
- 379 Gravatt Dr
- 373 Gravatt Dr
- 385 Gravatt Dr
- 363 Gravatt Dr
- 956 Alvarado Rd
- 389 Gravatt Dr
- 357 Gravatt Dr
- 965 Alvarado Rd
- 393 Gravatt Dr
- 845 Alvarado Rd