Estimated Value: $88,677 - $125,000
4
Beds
2
Baths
1,152
Sq Ft
$97/Sq Ft
Est. Value
About This Home
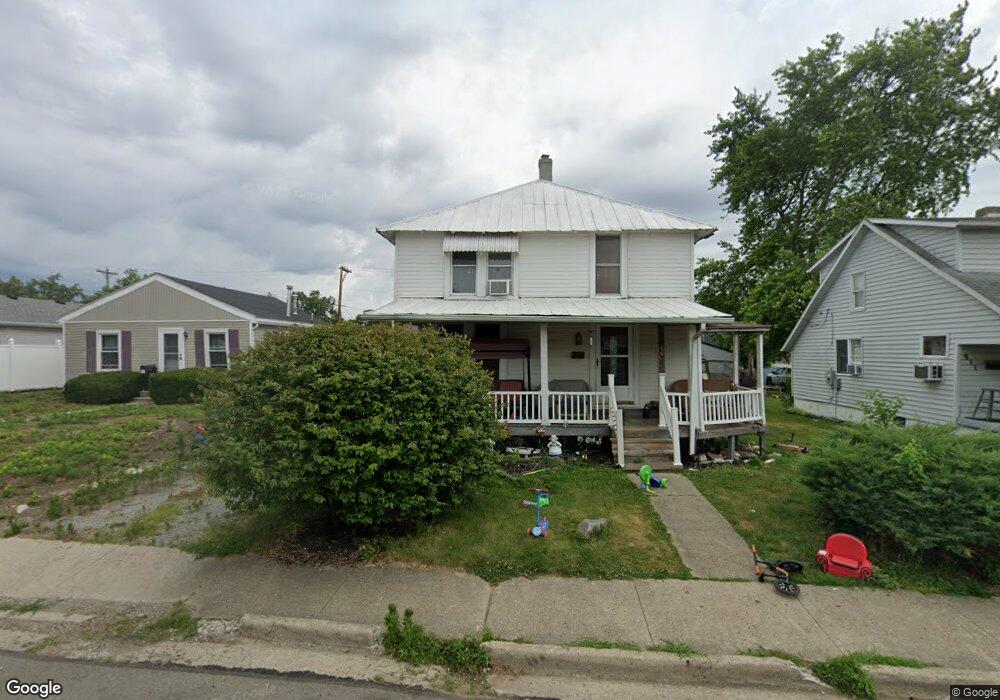
This home is located at 909 Boal Ave, Piqua, OH 45356 and is currently estimated at $111,169, approximately $96 per square foot. 909 Boal Ave is a home located in Miami County with nearby schools including Piqua Junior High School, Piqua High School, and Nicholas School.
Ownership History
Date
Name
Owned For
Owner Type
Purchase Details
Closed on
Apr 22, 2015
Sold by
Banhagel Matthew
Bought by
Gardner Lawrence F
Current Estimated Value
Home Financials for this Owner
Home Financials are based on the most recent Mortgage that was taken out on this home.
Original Mortgage
$6,214
Interest Rate
3.68%
Mortgage Type
Purchase Money Mortgage
Purchase Details
Closed on
Feb 23, 2015
Sold by
Fannie Mae
Bought by
Banhagel Matthew
Home Financials for this Owner
Home Financials are based on the most recent Mortgage that was taken out on this home.
Original Mortgage
$6,214
Interest Rate
3.68%
Mortgage Type
Purchase Money Mortgage
Purchase Details
Closed on
Aug 3, 1989
Bought by
Beckstedt George W
Create a Home Valuation Report for This Property
The Home Valuation Report is an in-depth analysis detailing your home's value as well as a comparison with similar homes in the area
Home Values in the Area
Average Home Value in this Area
Purchase History
| Date | Buyer | Sale Price | Title Company |
|---|---|---|---|
| Gardner Lawrence F | $37,700 | Attorney | |
| Banhagel Matthew | -- | Attorney | |
| Beckstedt George W | $19,000 | -- |
Source: Public Records
Mortgage History
| Date | Status | Borrower | Loan Amount |
|---|---|---|---|
| Closed | Gardner Lawrence F | $6,214 |
Source: Public Records
Tax History Compared to Growth
Tax History
| Year | Tax Paid | Tax Assessment Tax Assessment Total Assessment is a certain percentage of the fair market value that is determined by local assessors to be the total taxable value of land and additions on the property. | Land | Improvement |
|---|---|---|---|---|
| 2024 | $752 | $17,430 | $6,230 | $11,200 |
| 2023 | $716 | $17,430 | $6,230 | $11,200 |
| 2022 | $729 | $17,430 | $6,230 | $11,200 |
| 2021 | $591 | $12,920 | $4,620 | $8,300 |
| 2020 | $579 | $12,920 | $4,620 | $8,300 |
| 2019 | $582 | $12,920 | $4,620 | $8,300 |
| 2018 | $243 | $5,150 | $4,620 | $530 |
| 2017 | $246 | $5,150 | $4,620 | $530 |
| 2016 | $244 | $5,150 | $4,620 | $530 |
| 2015 | $656 | $4,940 | $4,450 | $490 |
| 2014 | $656 | $13,200 | $4,450 | $8,750 |
| 2013 | $658 | $13,200 | $4,450 | $8,750 |
Source: Public Records
Map
Nearby Homes
- 708 Brice Ave
- 825 Clark Ave
- 605 Boal Ave
- 807 Brook St
- 801 Manier Ave
- 730 Gordon St
- 1005 South St
- 707 Leonard St
- 1110 South St
- 635 Clark Ave
- 420 Summit St
- 1207 S Roosevelt Ave
- 416 Garnsey St
- 1505 Amherst Ave
- 624 Adams St
- 1502 Arrowhead Dr
- Ironwood Plan at Arrowhead Estates
- Juniper Plan at Arrowhead Estates
- Spruce Plan at Arrowhead Estates
- Aspen II Plan at Arrowhead Estates