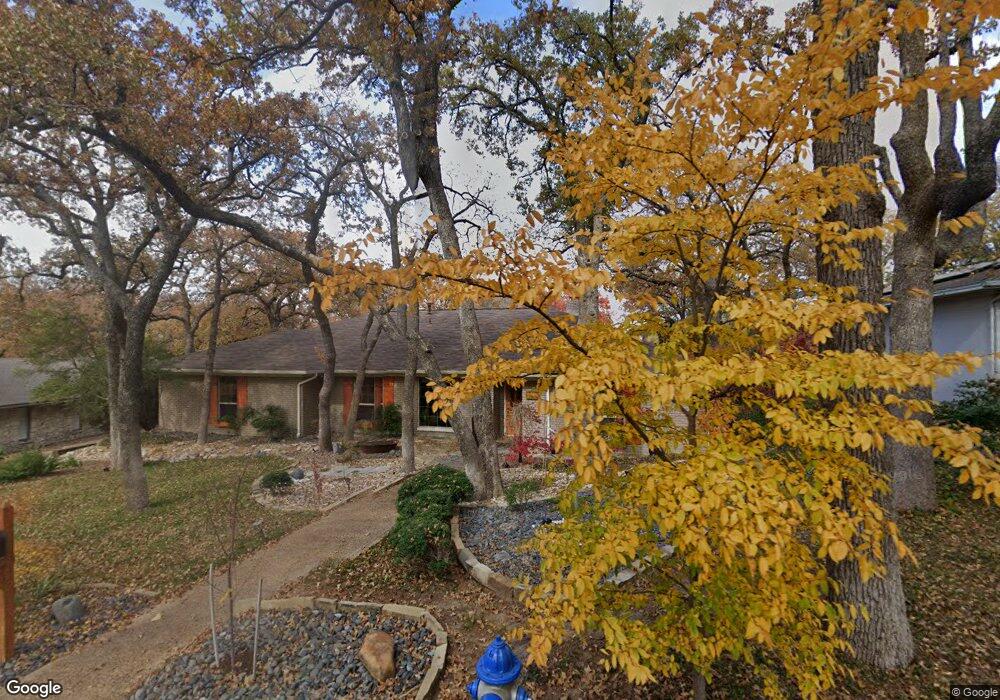
909 Chasewood Ln Denton, TX 76205
South Denton NeighborhoodEstimated Value: $435,000 - $488,000
4
Beds
3
Baths
2,788
Sq Ft
$165/Sq Ft
Est. Value
About This Home
This home is located at 909 Chasewood Ln, Denton, TX 76205 and is currently estimated at $461,391, approximately $165 per square foot. 909 Chasewood Ln is a home located in Denton County with nearby schools including Houston Elementary School, McMath Middle School, and Denton High School.
Ownership History
Date
Name
Owned For
Owner Type
Purchase Details
Closed on
Aug 7, 2020
Sold by
Cogan Karen
Bought by
Uglow Todd
Current Estimated Value
Home Financials for this Owner
Home Financials are based on the most recent Mortgage that was taken out on this home.
Original Mortgage
$299,474
Outstanding Balance
$265,654
Interest Rate
3%
Mortgage Type
FHA
Estimated Equity
$195,737
Purchase Details
Closed on
Apr 30, 2012
Sold by
Petrie Trent
Bought by
Cogan Karen
Home Financials for this Owner
Home Financials are based on the most recent Mortgage that was taken out on this home.
Original Mortgage
$85,900
Interest Rate
4.02%
Mortgage Type
New Conventional
Purchase Details
Closed on
Jun 28, 2002
Sold by
Cherrnay Eugene and Cherrnay Amy R
Bought by
Petrie Trent and Cogan Karen D
Home Financials for this Owner
Home Financials are based on the most recent Mortgage that was taken out on this home.
Original Mortgage
$85,900
Interest Rate
6.78%
Create a Home Valuation Report for This Property
The Home Valuation Report is an in-depth analysis detailing your home's value as well as a comparison with similar homes in the area
Home Values in the Area
Average Home Value in this Area
Purchase History
| Date | Buyer | Sale Price | Title Company |
|---|---|---|---|
| Uglow Todd | -- | Alamo Title Flower Mound | |
| Cogan Karen | -- | None Available | |
| Petrie Trent | -- | -- |
Source: Public Records
Mortgage History
| Date | Status | Borrower | Loan Amount |
|---|---|---|---|
| Open | Uglow Todd | $299,474 | |
| Previous Owner | Cogan Karen | $85,900 | |
| Previous Owner | Petrie Trent | $85,900 |
Source: Public Records
Tax History Compared to Growth
Tax History
| Year | Tax Paid | Tax Assessment Tax Assessment Total Assessment is a certain percentage of the fair market value that is determined by local assessors to be the total taxable value of land and additions on the property. | Land | Improvement |
|---|---|---|---|---|
| 2025 | $5,834 | $325,146 | $111,881 | $213,265 |
| 2024 | $7,030 | $364,216 | $111,881 | $252,335 |
| 2023 | $5,339 | $342,309 | $111,881 | $254,824 |
| 2022 | $6,606 | $311,190 | $98,719 | $246,343 |
| 2021 | $6,289 | $282,900 | $65,813 | $217,087 |
| 2020 | $6,096 | $266,679 | $65,813 | $200,866 |
| 2019 | $6,444 | $270,061 | $65,813 | $204,248 |
| 2018 | $6,254 | $258,888 | $65,813 | $193,075 |
| 2017 | $6,003 | $242,880 | $65,813 | $177,067 |
| 2016 | $5,450 | $222,124 | $65,813 | $156,311 |
| 2015 | $4,405 | $205,336 | $65,813 | $141,033 |
| 2014 | $4,405 | $186,669 | $71,843 | $114,826 |
| 2013 | -- | $192,088 | $71,843 | $120,245 |
Source: Public Records
Map
Nearby Homes
- 2100 Fairfax Rd
- 2012 Hollyhill Ln
- 2120 Fairfax Rd
- 412 Hollyhill Ln Unit 412
- 408 Hollyhill Ln
- 2216 Jefferson Trail
- 2226 Savannah Trail
- 2218 Southridge Dr
- 924 Ridgecrest Cir
- 209 Pennsylvania Dr
- 1000 Lynhurst Ln
- 829 Skylark Dr
- 821 Sandpiper Dr
- 1412 Ridgecrest Cir
- 824 Sandpiper Dr
- 1500 Sandy Creek Dr
- 2253 Hollyhill Ln
- 816 Chapel Dr
- 916 Smokerise Cir
- 1012 Indian Ridge Dr
- 913 Chasewood Ln
- 905 Chasewood Ln
- 917 Chasewood Ln
- 910 Chasewood Ln
- 2029 Pembrooke Place
- 2101 Pembrooke Place
- 916 Chasewood Ln
- 2025 Pembrooke Place
- 2008 Woodbrook St
- 2105 Pembrooke Place
- 2100 Woodbrook St
- 2004 Woodbrook St Unit 20
- 2006 Woodbrook St
- 2007 Teasley Ln
- 2100 Pembrooke Place
- 900 Londonderry Ln
- 2021 Pembrooke Place
- 2104 Woodbrook St
- 2024 Pembrooke Place
- 2104 Pembrooke Place