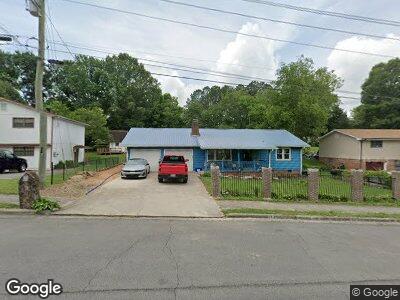
909 Clark St Dalton, GA 30720
Estimated Value: $237,482 - $284,000
3
Beds
2
Baths
1,631
Sq Ft
$154/Sq Ft
Est. Value
About This Home
This home is located at 909 Clark St, Dalton, GA 30720 and is currently estimated at $251,621, approximately $154 per square foot. 909 Clark St is a home located in Whitfield County with nearby schools including Westwood Elementary School, Dalton Middle School, and Dalton High School.
Ownership History
Date
Name
Owned For
Owner Type
Purchase Details
Closed on
Mar 4, 2011
Sold by
Federal National Mortgage Association
Bought by
Nunez Jose D
Current Estimated Value
Home Financials for this Owner
Home Financials are based on the most recent Mortgage that was taken out on this home.
Original Mortgage
$74,073
Interest Rate
4.75%
Mortgage Type
FHA
Purchase Details
Closed on
Feb 19, 2008
Sold by
Not Provided
Bought by
Nunez Jose D
Home Financials for this Owner
Home Financials are based on the most recent Mortgage that was taken out on this home.
Original Mortgage
$126,000
Interest Rate
5.46%
Mortgage Type
New Conventional
Purchase Details
Closed on
Sep 14, 2007
Sold by
Capistran Raul
Bought by
Munguia Monica A
Purchase Details
Closed on
Apr 10, 2000
Sold by
Presley Horton and Presley Lorena
Bought by
Capistrab Raul and Chavez Ignacia
Purchase Details
Closed on
May 1, 1994
Bought by
Presley Horton and Presley Lorena
Create a Home Valuation Report for This Property
The Home Valuation Report is an in-depth analysis detailing your home's value as well as a comparison with similar homes in the area
Home Values in the Area
Average Home Value in this Area
Purchase History
| Date | Buyer | Sale Price | Title Company |
|---|---|---|---|
| Nunez Jose D | $106,878 | -- | |
| Nunez Jose D | -- | -- | |
| Capistran Raul | -- | -- | |
| Munguia Monica A | -- | -- | |
| Capistrab Raul | $99,000 | -- | |
| Presley Horton | $79,900 | -- |
Source: Public Records
Mortgage History
| Date | Status | Borrower | Loan Amount |
|---|---|---|---|
| Open | Nunez Jose D | $191,798 | |
| Closed | Nunez Jose D | $161,015 | |
| Closed | Nunez Jose D | $8,128 | |
| Closed | Nunez Jose | $20,600 | |
| Closed | Nunez Jose D | $98,539 | |
| Closed | Nunez Jose D | $74,073 | |
| Previous Owner | Capistran Raul | $126,000 | |
| Previous Owner | Capistran Raul | $30,000 |
Source: Public Records
Tax History Compared to Growth
Tax History
| Year | Tax Paid | Tax Assessment Tax Assessment Total Assessment is a certain percentage of the fair market value that is determined by local assessors to be the total taxable value of land and additions on the property. | Land | Improvement |
|---|---|---|---|---|
| 2024 | $2,014 | $65,691 | $6,800 | $58,891 |
| 2023 | $2,014 | $60,480 | $8,100 | $52,380 |
| 2022 | $1,432 | $48,962 | $5,670 | $43,292 |
| 2021 | $1,434 | $48,962 | $5,670 | $43,292 |
| 2020 | $1,478 | $48,962 | $5,670 | $43,292 |
| 2019 | $1,520 | $48,962 | $5,670 | $43,292 |
| 2018 | $1,463 | $46,994 | $5,670 | $41,324 |
| 2017 | $1,403 | $46,994 | $5,670 | $41,324 |
| 2016 | $1,187 | $40,892 | $3,308 | $37,584 |
| 2014 | $1,057 | $38,944 | $3,150 | $35,794 |
| 2013 | -- | $38,944 | $3,150 | $35,794 |
Source: Public Records
Map
Nearby Homes