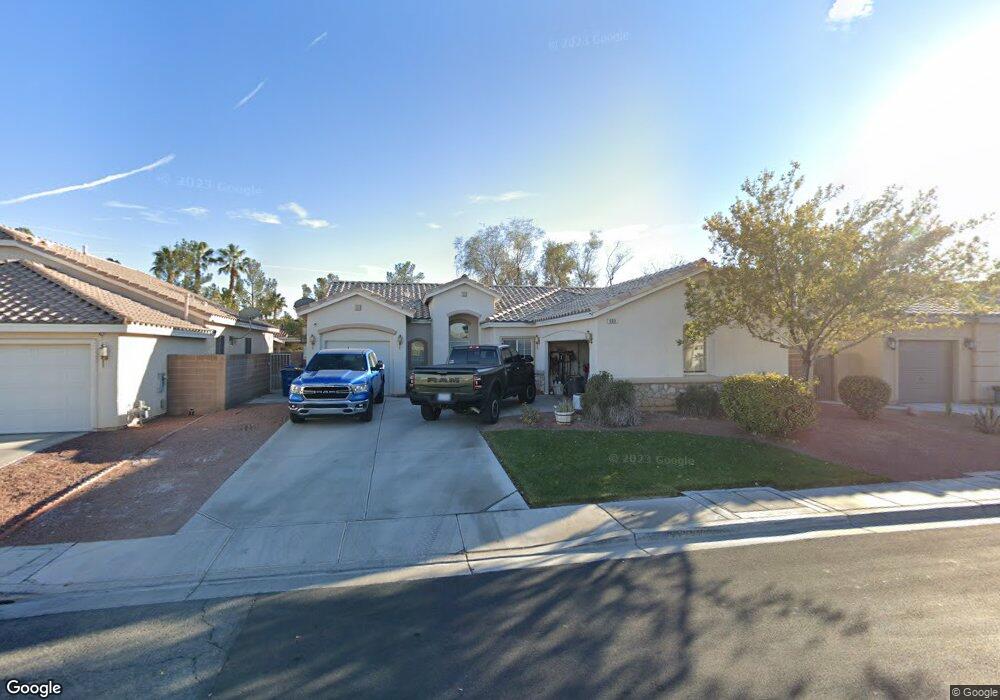
909 Coldwater Falls Way Las Vegas, NV 89123
Silverado Ranch NeighborhoodEstimated Value: $488,918 - $527,000
3
Beds
2
Baths
1,758
Sq Ft
$291/Sq Ft
Est. Value
About This Home
This home is located at 909 Coldwater Falls Way, Las Vegas, NV 89123 and is currently estimated at $510,980, approximately $290 per square foot. 909 Coldwater Falls Way is a home located in Clark County with nearby schools including John R Beatty Elementary School, Jack Lund Schofield Middle School, and Silverado High School.
Ownership History
Date
Name
Owned For
Owner Type
Purchase Details
Closed on
May 3, 2007
Sold by
Reber Robert E
Bought by
Seitz Christopher C and Treger Marjorie A
Current Estimated Value
Home Financials for this Owner
Home Financials are based on the most recent Mortgage that was taken out on this home.
Original Mortgage
$325,000
Outstanding Balance
$197,147
Interest Rate
6.12%
Mortgage Type
Unknown
Estimated Equity
$313,833
Purchase Details
Closed on
Mar 20, 2000
Sold by
Denison Dion D and Denison Lisa M
Bought by
Reber Robert E
Home Financials for this Owner
Home Financials are based on the most recent Mortgage that was taken out on this home.
Original Mortgage
$132,800
Interest Rate
8.38%
Purchase Details
Closed on
Dec 28, 1998
Sold by
Bilt Perma
Bought by
Denison Dion D and Denison Lisa M
Home Financials for this Owner
Home Financials are based on the most recent Mortgage that was taken out on this home.
Original Mortgage
$153,800
Interest Rate
6.82%
Create a Home Valuation Report for This Property
The Home Valuation Report is an in-depth analysis detailing your home's value as well as a comparison with similar homes in the area
Home Values in the Area
Average Home Value in this Area
Purchase History
| Date | Buyer | Sale Price | Title Company |
|---|---|---|---|
| Seitz Christopher C | $359,000 | First Amer Title Co Of Nv | |
| Reber Robert E | $166,000 | Stewart Title | |
| Denison Dion D | $162,000 | Nevada Title Company |
Source: Public Records
Mortgage History
| Date | Status | Borrower | Loan Amount |
|---|---|---|---|
| Open | Seitz Christopher C | $325,000 | |
| Previous Owner | Reber Robert E | $132,800 | |
| Previous Owner | Denison Dion D | $153,800 |
Source: Public Records
Tax History Compared to Growth
Tax History
| Year | Tax Paid | Tax Assessment Tax Assessment Total Assessment is a certain percentage of the fair market value that is determined by local assessors to be the total taxable value of land and additions on the property. | Land | Improvement |
|---|---|---|---|---|
| 2025 | $2,499 | $125,449 | $45,500 | $79,949 |
| 2024 | $2,427 | $125,449 | $45,500 | $79,949 |
| 2023 | $1,998 | $117,637 | $42,000 | $75,637 |
| 2022 | $2,358 | $104,892 | $35,700 | $69,192 |
| 2021 | $2,541 | $97,145 | $31,150 | $65,995 |
| 2020 | $1,956 | $95,107 | $29,750 | $65,357 |
| 2019 | $1,899 | $92,387 | $28,000 | $64,387 |
| 2018 | $1,844 | $86,842 | $24,500 | $62,342 |
| 2017 | $2,598 | $88,581 | $25,200 | $63,381 |
| 2016 | $1,998 | $80,218 | $16,800 | $63,418 |
| 2015 | $1,975 | $64,066 | $13,300 | $50,766 |
| 2014 | $1,691 | $60,225 | $8,750 | $51,475 |
Source: Public Records
Map
Nearby Homes
- 1006 Coldwater Falls Way
- 8777 Shady Peak Way Unit 2
- 8870 Star Canyon Way
- 8880 Star Valley Ct
- 8940 Sandy Slate Way
- 8698 Waterford Bend St
- 875 Rainbow Rock St
- 8959 Coral Shale St
- 1058 Warm Canyon Way
- 971 Whispering Grove Ave
- 1115 Aldenwood Ave
- 1123 Aldenwood Ave
- 8840 Quintane Ln
- 8570 Auburn Leaf St
- 9076 Quarrystone Way
- 927 Clear Diamond Ave
- 861 Clear Diamond Ave
- 920 Clear Diamond Ave
- 960 Clear Diamond Ave
- 896 Clear Diamond Ave
- 917 Coldwater Falls Way
- 925 Coldwater Falls Way
- 893 Coldwater Falls Way
- 893 Coldwater Falls Way
- 920 Coldwater Falls Way
- 920 Garden Breeze Way
- 910 Garden Breeze Way
- 900 Coldwater Falls Way Unit 7
- 930 Garden Breeze Way
- 933 Coldwater Falls Way
- 885 Coldwater Falls Way
- 930 Coldwater Falls Way
- 900 Garden Breeze Way
- 940 Garden Breeze Way
- 890 Coldwater Falls Way
- 936 Coldwater Falls Way
- 943 Coldwater Falls Way
- 877 Coldwater Falls Way
- 950 Garden Breeze Way
- 8750 Country Ridge Ct