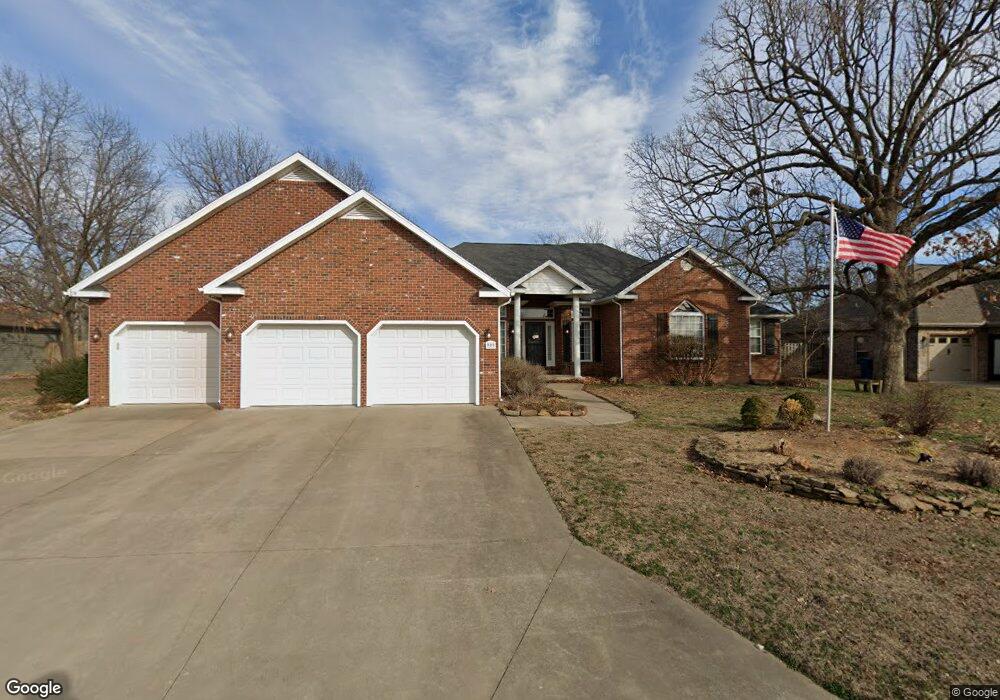
909 Dogwood Trail Loop Carl Junction, MO 64834
Estimated Value: $351,574 - $424,000
4
Beds
2
Baths
2,435
Sq Ft
$162/Sq Ft
Est. Value
About This Home
This home is located at 909 Dogwood Trail Loop, Carl Junction, MO 64834 and is currently estimated at $395,144, approximately $162 per square foot. 909 Dogwood Trail Loop is a home located in Jasper County with nearby schools including Carl Junction Primary School (K-1), Carl Junction Intermediate School, and Carl Junction Primary School (2-3).
Ownership History
Date
Name
Owned For
Owner Type
Purchase Details
Closed on
Aug 21, 2018
Sold by
Drost Terry L and Drost Joann C
Bought by
Terry & Joann Drost Ret
Current Estimated Value
Purchase Details
Closed on
May 25, 2007
Sold by
Miles Shynda F
Bought by
Drost Terry L and Drost Joann C
Home Financials for this Owner
Home Financials are based on the most recent Mortgage that was taken out on this home.
Original Mortgage
$150,000
Interest Rate
6.17%
Mortgage Type
Purchase Money Mortgage
Create a Home Valuation Report for This Property
The Home Valuation Report is an in-depth analysis detailing your home's value as well as a comparison with similar homes in the area
Purchase History
| Date | Buyer | Sale Price | Title Company |
|---|---|---|---|
| Terry & Joann Drost Ret | -- | -- | |
| Drost Terry L | -- | Fatco |
Source: Public Records
Mortgage History
| Date | Status | Borrower | Loan Amount |
|---|---|---|---|
| Previous Owner | Drost Terry L | $150,000 |
Source: Public Records
Tax History
| Year | Tax Paid | Tax Assessment Tax Assessment Total Assessment is a certain percentage of the fair market value that is determined by local assessors to be the total taxable value of land and additions on the property. | Land | Improvement |
|---|---|---|---|---|
| 2025 | $2,424 | $47,430 | $4,130 | $43,300 |
| 2024 | $2,439 | $41,920 | $4,130 | $37,790 |
| 2023 | $2,439 | $41,920 | $4,130 | $37,790 |
| 2022 | $2,483 | $42,560 | $4,130 | $38,430 |
| 2021 | $2,126 | $42,560 | $4,130 | $38,430 |
| 2020 | $1,988 | $39,170 | $4,130 | $35,040 |
| 2019 | $1,886 | $39,170 | $4,130 | $35,040 |
| 2018 | $2,033 | $42,360 | $0 | $0 |
| 2017 | $2,039 | $42,360 | $0 | $0 |
| 2016 | $2,061 | $43,220 | $0 | $0 |
| 2015 | $2,017 | $43,220 | $0 | $0 |
| 2014 | $2,017 | $43,220 | $0 | $0 |
Source: Public Records
Map
Nearby Homes
- 401 Dogwood Trails Loop
- 6548 Mo-171
- 25122 Gum Rd
- 112 Red Oak Dr
- 123 Rocky Ln
- 121 Forest Dr
- XXX Lone Elm
- Lot 1B Hwy 171 & Fir Rd
- Lot 1A Hwy 171 & Fir Rd
- 25452 Leffen Ln
- Lot 1 Hwy 171 & Fir Rd
- LOT 4C Hwy 171 & Fir Rd Unit 4C
- 232 Hickory Place
- 5981 Pearl St
- Xxx Wall St
- 2626 Joplin St
- 710 Briarbrook Dr
- 501 Anita Dr
- 106 Victoria Ln
- TBD Wall St
- 909 Dogwood Trail Loop
- 909 Dogwood Trails Loop
- 901 Dogwood Trail Loop
- 902 Dogwood Trail Loop
- 907 Dogwood Trail Loop
- 911 Dogwood Loop
- 913 Dogwood Trail Loop
- 910 Dogwood Trails Loop
- 912 Dogwood Trails Loop
- 910 Dogwood Trail Loop
- 912 Dogwood Trail Loop
- 905 Dogwood Trail Loop
- 908 Dogwood Trails Loop
- 6870 County Lane 255
- 908 Dogwood Trail Loop
- 914 Dogwood Trails Loop
- 914 Dogwood Trail Loop
- 906 Dogwood Trails Loop
- 906 Dogwood Trail Loop
- 903 Dogwood Trail Loop
Your Personal Tour Guide
Ask me questions while you tour the home.