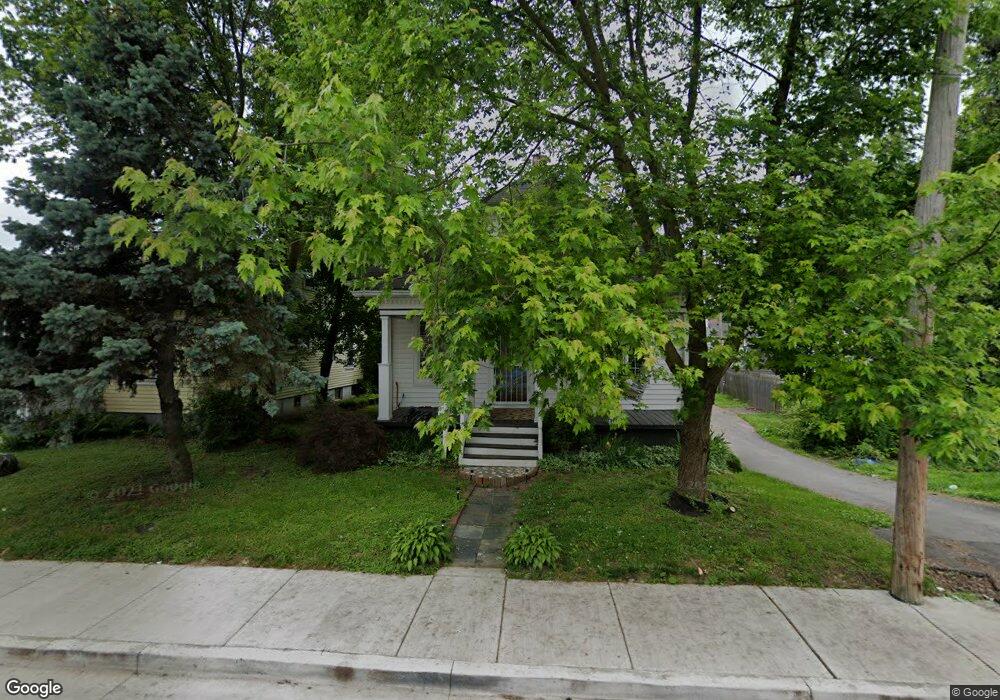
909 E 15th St New Albany, IN 47150
Estimated Value: $210,180 - $241,000
3
Beds
1
Bath
1,638
Sq Ft
$135/Sq Ft
Est. Value
About This Home
This home is located at 909 E 15th St, New Albany, IN 47150 and is currently estimated at $220,545, approximately $134 per square foot. 909 E 15th St is a home located in Floyd County with nearby schools including S. Ellen Jones Elementary School, Hazelwood Middle School, and New Albany Senior High School.
Ownership History
Date
Name
Owned For
Owner Type
Purchase Details
Closed on
Oct 18, 2021
Sold by
Vansickle Lucas
Bought by
Mudd Gary Allen
Current Estimated Value
Home Financials for this Owner
Home Financials are based on the most recent Mortgage that was taken out on this home.
Original Mortgage
$161,500
Outstanding Balance
$147,273
Interest Rate
2.8%
Mortgage Type
New Conventional
Estimated Equity
$73,272
Purchase Details
Closed on
Jun 29, 2007
Sold by
Endris Michael L and Endris Mary Ann
Bought by
Vansickle Lucas
Home Financials for this Owner
Home Financials are based on the most recent Mortgage that was taken out on this home.
Original Mortgage
$52,000
Interest Rate
6.76%
Mortgage Type
New Conventional
Purchase Details
Closed on
Mar 9, 2007
Sold by
Flanagan Linda and Endris Linda
Bought by
Endris Michael L
Create a Home Valuation Report for This Property
The Home Valuation Report is an in-depth analysis detailing your home's value as well as a comparison with similar homes in the area
Home Values in the Area
Average Home Value in this Area
Purchase History
| Date | Buyer | Sale Price | Title Company |
|---|---|---|---|
| Mudd Gary Allen | $340,000 | Limestone Title | |
| Vansickle Lucas | -- | Infinity Title | |
| Endris Michael L | -- | None Available |
Source: Public Records
Mortgage History
| Date | Status | Borrower | Loan Amount |
|---|---|---|---|
| Open | Mudd Gary Allen | $161,500 | |
| Previous Owner | Vansickle Lucas | $52,000 |
Source: Public Records
Tax History Compared to Growth
Tax History
| Year | Tax Paid | Tax Assessment Tax Assessment Total Assessment is a certain percentage of the fair market value that is determined by local assessors to be the total taxable value of land and additions on the property. | Land | Improvement |
|---|---|---|---|---|
| 2024 | $1,157 | $117,900 | $14,000 | $103,900 |
| 2023 | $1,178 | $120,300 | $14,000 | $106,300 |
| 2022 | $1,161 | $115,200 | $14,000 | $101,200 |
| 2021 | $1,089 | $106,800 | $14,000 | $92,800 |
| 2020 | $2,302 | $106,800 | $14,000 | $92,800 |
| 2019 | $2,429 | $112,600 | $14,000 | $98,600 |
| 2018 | $2,296 | $105,800 | $14,000 | $91,800 |
| 2017 | $2,323 | $105,200 | $14,000 | $91,200 |
| 2016 | $828 | $98,600 | $14,000 | $84,600 |
| 2014 | $493 | $72,300 | $14,000 | $58,300 |
| 2013 | -- | $73,800 | $14,000 | $59,800 |
Source: Public Records
Map
Nearby Homes
- 830 Cedar Bough Place
- 1314 Chartres St
- 1406 Chartres St
- 1412 Chartres St
- 1120 Chartres St
- 1314 Ekin Ave
- 1205 Ekin Ave
- 1313 Culbertson Ave
- 1011 Vincennes St Unit 5
- 1119 Ekin Ave
- 1605 Culbertson Ave
- 608 E Oak St
- 1727 E Oak St
- 1809 E Oak St
- 1748 E Oak St
- 416 E 11th St
- 1711 Charlestown Rd
- 336 E 16th St
- 335 E 15th St
- 1743 E Spring St
- 907 E 15th St
- 905 E 15th St
- 1340 Beeler St
- 1338 Beeler St
- 1342 Beeler St
- 903 E 15th St
- 830 Catherine Place
- 828 Catherine Place
- 1501 Shelby Place
- 826 Catherine Place
- 832 Catherine Place
- 901 E 15th St
- 1503 Shelby Place
- 822 Catherine Place
- 834 Catherine Place
- 820 Catherine Place
- 1505 Shelby Place
- 845 E 15th St
- 818 Catherine Place
- 1339 Beeler St