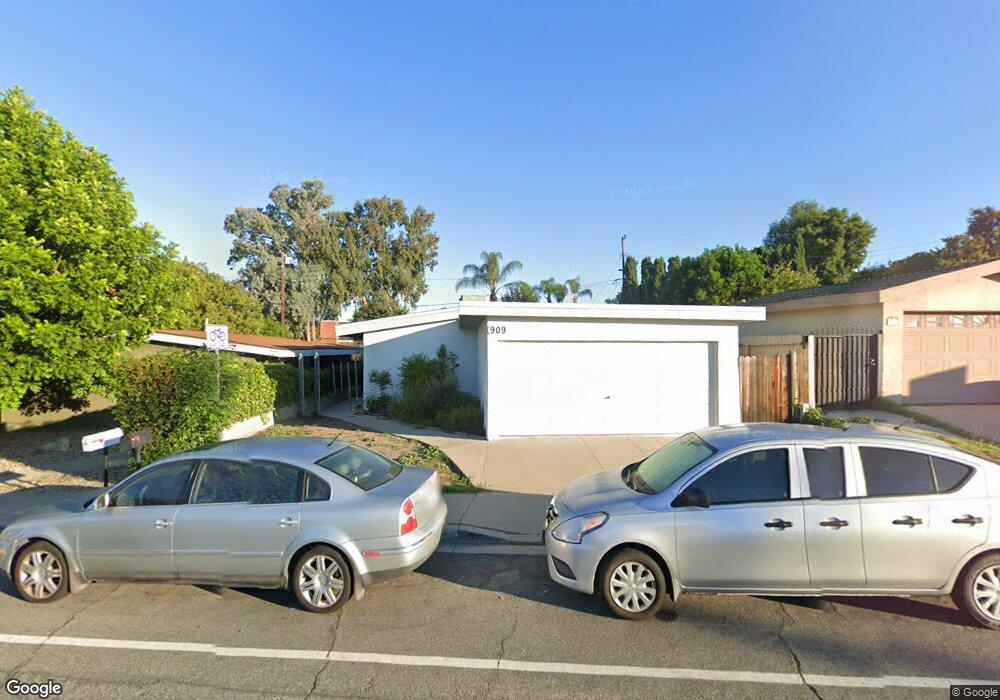
909 E Hillcrest Dr Thousand Oaks, CA 91360
Estimated Value: $655,000 - $702,196
2
Beds
1
Bath
1,066
Sq Ft
$646/Sq Ft
Est. Value
About This Home
This home is located at 909 E Hillcrest Dr, Thousand Oaks, CA 91360 and is currently estimated at $688,799, approximately $646 per square foot. 909 E Hillcrest Dr is a home located in Ventura County with nearby schools including Glenwood Elementary School, Colina Middle School, and Westlake High School.
Ownership History
Date
Name
Owned For
Owner Type
Purchase Details
Closed on
Dec 3, 2020
Sold by
Johnson Jay Leonard
Bought by
Johnson Jay L
Current Estimated Value
Home Financials for this Owner
Home Financials are based on the most recent Mortgage that was taken out on this home.
Original Mortgage
$171,000
Outstanding Balance
$152,512
Interest Rate
2.8%
Mortgage Type
New Conventional
Estimated Equity
$536,287
Purchase Details
Closed on
Sep 27, 2005
Sold by
Johnson Rachelle Louise
Bought by
Johnson Jay Leonard
Home Financials for this Owner
Home Financials are based on the most recent Mortgage that was taken out on this home.
Original Mortgage
$290,000
Interest Rate
5.72%
Mortgage Type
Fannie Mae Freddie Mac
Create a Home Valuation Report for This Property
The Home Valuation Report is an in-depth analysis detailing your home's value as well as a comparison with similar homes in the area
Home Values in the Area
Average Home Value in this Area
Purchase History
| Date | Buyer | Sale Price | Title Company |
|---|---|---|---|
| Johnson Jay L | -- | Lawyers Title | |
| Johnson Jay Leonard | -- | Gateway Title Company | |
| Johnson Jay Leonard | $145,000 | Gateway Title Company |
Source: Public Records
Mortgage History
| Date | Status | Borrower | Loan Amount |
|---|---|---|---|
| Open | Johnson Jay L | $171,000 | |
| Closed | Johnson Jay Leonard | $290,000 |
Source: Public Records
Tax History Compared to Growth
Tax History
| Year | Tax Paid | Tax Assessment Tax Assessment Total Assessment is a certain percentage of the fair market value that is determined by local assessors to be the total taxable value of land and additions on the property. | Land | Improvement |
|---|---|---|---|---|
| 2025 | $5,069 | $442,752 | $376,856 | $65,896 |
| 2024 | $5,069 | $434,071 | $369,467 | $64,604 |
| 2023 | $4,911 | $425,560 | $362,222 | $63,338 |
| 2022 | $4,824 | $417,216 | $355,119 | $62,097 |
| 2021 | $4,742 | $409,036 | $348,156 | $60,880 |
| 2020 | $4,326 | $404,843 | $344,587 | $60,256 |
| 2019 | $4,213 | $396,906 | $337,831 | $59,075 |
| 2018 | $4,129 | $389,124 | $331,207 | $57,917 |
| 2017 | $4,050 | $381,495 | $324,713 | $56,782 |
| 2016 | $4,012 | $374,016 | $318,347 | $55,669 |
| 2015 | $3,943 | $368,400 | $313,566 | $54,834 |
| 2014 | $3,887 | $361,186 | $307,425 | $53,761 |
Source: Public Records
Map
Nearby Homes
- 978 Bower Way
- 245 Houston Dr
- 1000 E Thousand Oaks Blvd
- 647 Brossard Dr
- 1340 E Hillcrest Dr Unit 8
- 1342 E Hillcrest Dr Unit 20
- 566 Rancho Rd
- 110 Maegan Place Unit 13
- 918 Rancho Rd
- 68 Maegan Place Unit 7
- 62 Maegan Place Unit 4
- 86 Maegan Place Unit 4
- 56 Maegan Place Unit 4
- 1248 La Peresa Dr
- 1649 Hauser Cir
- 1710 E Thousand Oaks Blvd
- 331 Dryden St
- 932 Rosario Dr
- 96 Erbes Rd
- 170 Erbes Rd
- 897 E Hillcrest Dr
- 917 E Hillcrest Dr
- 925 E Hillcrest Dr
- 885 E Hillcrest Dr
- 935 E Hillcrest Dr
- 875 E Hillcrest Dr
- 290 Houston Dr
- 284 Houston Dr
- 292 Houston Dr
- 276 Houston Dr
- 945 E Hillcrest Dr
- 268 Houston Dr
- 930 Bower Way
- 942 Bower Way
- 902 E Hillcrest Dr
- 914 E Hillcrest Dr
- 260 Houston Dr
- 920 Bower Way
- 888 E Hillcrest Dr
- 920 E Hillcrest Dr