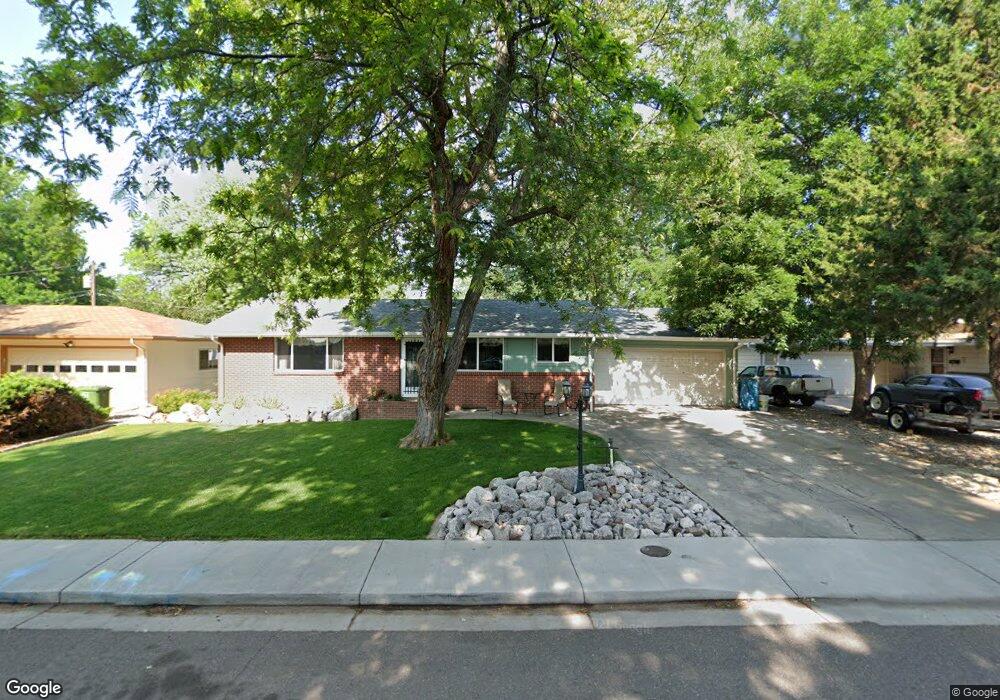
909 E Kelly Dr Loveland, CO 80537
Estimated Value: $443,000 - $542,000
3
Beds
2
Baths
1,092
Sq Ft
$448/Sq Ft
Est. Value
About This Home
This home is located at 909 E Kelly Dr, Loveland, CO 80537 and is currently estimated at $488,781, approximately $447 per square foot. 909 E Kelly Dr is a home located in Larimer County with nearby schools including Garfield Elementary School, Bill Reed Middle School, and Loveland High School.
Ownership History
Date
Name
Owned For
Owner Type
Purchase Details
Closed on
Apr 30, 1998
Sold by
Rhodes Michael A and Rhodes Michelle S
Bought by
Segerstrom Stewart W
Current Estimated Value
Home Financials for this Owner
Home Financials are based on the most recent Mortgage that was taken out on this home.
Original Mortgage
$138,088
Outstanding Balance
$26,958
Interest Rate
7.09%
Mortgage Type
FHA
Estimated Equity
$461,823
Purchase Details
Closed on
Apr 25, 1997
Sold by
Tarbox Byron R
Bought by
Rhodes Michael A and Rhodes Michelle C
Home Financials for this Owner
Home Financials are based on the most recent Mortgage that was taken out on this home.
Original Mortgage
$125,000
Interest Rate
8.37%
Purchase Details
Closed on
Apr 1, 1996
Sold by
Tarbox Barbara A
Bought by
Tarbox Byron R
Purchase Details
Closed on
Aug 1, 1993
Sold by
Tarbox Bryon R
Bought by
Tarbox Barbara Ann
Create a Home Valuation Report for This Property
The Home Valuation Report is an in-depth analysis detailing your home's value as well as a comparison with similar homes in the area
Home Values in the Area
Average Home Value in this Area
Purchase History
| Date | Buyer | Sale Price | Title Company |
|---|---|---|---|
| Segerstrom Stewart W | $140,500 | -- | |
| Rhodes Michael A | $140,000 | -- | |
| Tarbox Byron R | -- | -- | |
| Tarbox Barbara Ann | -- | -- |
Source: Public Records
Mortgage History
| Date | Status | Borrower | Loan Amount |
|---|---|---|---|
| Open | Segerstrom Stewart W | $138,088 | |
| Previous Owner | Rhodes Michael A | $125,000 |
Source: Public Records
Tax History Compared to Growth
Tax History
| Year | Tax Paid | Tax Assessment Tax Assessment Total Assessment is a certain percentage of the fair market value that is determined by local assessors to be the total taxable value of land and additions on the property. | Land | Improvement |
|---|---|---|---|---|
| 2025 | $1,685 | $31,503 | $3,149 | $28,354 |
| 2024 | $1,625 | $31,503 | $3,149 | $28,354 |
| 2022 | $1,324 | $23,596 | $3,267 | $20,329 |
| 2021 | $1,929 | $24,275 | $3,361 | $20,914 |
| 2020 | $1,735 | $21,815 | $3,361 | $18,454 |
| 2019 | $1,705 | $21,815 | $3,361 | $18,454 |
| 2018 | $1,509 | $18,331 | $3,384 | $14,947 |
| 2017 | $1,299 | $18,331 | $3,384 | $14,947 |
| 2016 | $1,180 | $16,095 | $3,741 | $12,354 |
| 2015 | $1,171 | $16,090 | $3,740 | $12,350 |
| 2014 | $1,047 | $13,930 | $3,740 | $10,190 |
Source: Public Records
Map
Nearby Homes
- 901 W Kelly Dr
- 1658 Taft Gardens Cir
- 1667 Taft Gardens Cir
- 1714 W 8th St
- 1100 Taft Ave Unit 46
- 1100 Taft Ave
- 1404 W 6th St
- 1209 E Broadmoor Dr
- 1125 W Broadmoor Dr
- 1100 N Taft Ave Unit 27
- 1607 W U S 34
- 1131 W Broadmoor Dr
- 1230 W 6th St
- 1205 Loch Mount Dr
- 1016 Winona Cir
- 1725 Keyes Ct
- 1502 Westshore Dr
- 2030 W 17th St Unit A8
- 1633 Van Buren Ave Unit 1
- 1506 N Empire Ave
- 913 E Kelly Dr
- 905 E Kelly Dr
- 906 Litle Ct
- 910 Litle Ct
- 902 Litle Ct
- 917 E Kelly Dr
- 819 E Kelly Dr
- 908 E Kelly Dr
- 816 Litle Ct
- 912 E Kelly Dr
- 904 E Kelly Dr
- 815 E Kelly Dr
- 916 E Kelly Dr
- 822 E Kelly Dr
- 812 Litle Ct
- 817 Litle Ct
- 915 W Kelly Dr
- 1640 Taft Gardens Cir
- 1676 N Taft Ave
- 1676 Taft Gardens Cir