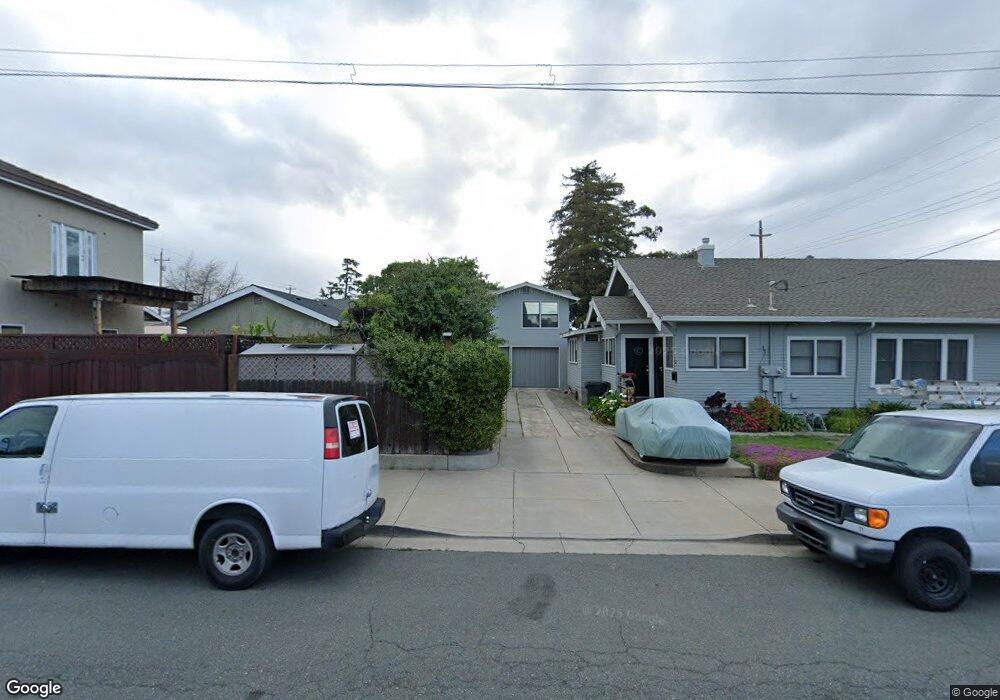
909 E St Unit 13TH Antioch, CA 94509
North Antioch NeighborhoodEstimated Value: $425,000 - $482,000
3
Beds
1
Bath
1,070
Sq Ft
$420/Sq Ft
Est. Value
About This Home
This home is located at 909 E St Unit 13TH, Antioch, CA 94509 and is currently estimated at $449,552, approximately $420 per square foot. 909 E St Unit 13TH is a home located in Contra Costa County with nearby schools including Fremont Elementary School, Antioch Middle School, and Antioch High School.
Ownership History
Date
Name
Owned For
Owner Type
Purchase Details
Closed on
Nov 14, 1997
Sold by
Wood Sarah E and Wood Ronald Renirie
Bought by
Jones Larry and Jones Judy
Current Estimated Value
Home Financials for this Owner
Home Financials are based on the most recent Mortgage that was taken out on this home.
Original Mortgage
$106,379
Outstanding Balance
$17,381
Interest Rate
7.23%
Mortgage Type
FHA
Estimated Equity
$432,171
Create a Home Valuation Report for This Property
The Home Valuation Report is an in-depth analysis detailing your home's value as well as a comparison with similar homes in the area
Home Values in the Area
Average Home Value in this Area
Purchase History
| Date | Buyer | Sale Price | Title Company |
|---|---|---|---|
| Jones Larry | $107,000 | Placer Title Company |
Source: Public Records
Mortgage History
| Date | Status | Borrower | Loan Amount |
|---|---|---|---|
| Open | Jones Larry | $106,379 |
Source: Public Records
Tax History
| Year | Tax Paid | Tax Assessment Tax Assessment Total Assessment is a certain percentage of the fair market value that is determined by local assessors to be the total taxable value of land and additions on the property. | Land | Improvement |
|---|---|---|---|---|
| 2025 | $2,465 | $175,891 | $47,884 | $128,007 |
| 2024 | $2,318 | $172,444 | $46,946 | $125,498 |
| 2023 | $2,318 | $169,064 | $46,026 | $123,038 |
| 2022 | $2,285 | $165,750 | $45,124 | $120,626 |
| 2021 | $2,195 | $162,501 | $44,240 | $118,261 |
| 2019 | $2,148 | $157,683 | $42,929 | $114,754 |
| 2018 | $2,071 | $154,592 | $42,088 | $112,504 |
| 2017 | $2,013 | $151,562 | $41,263 | $110,299 |
| 2016 | $1,954 | $148,591 | $40,454 | $108,137 |
| 2015 | $1,927 | $146,360 | $39,847 | $106,513 |
| 2014 | $1,865 | $143,494 | $39,067 | $104,427 |
Source: Public Records
Map
Nearby Homes
Your Personal Tour Guide
Ask me questions while you tour the home.