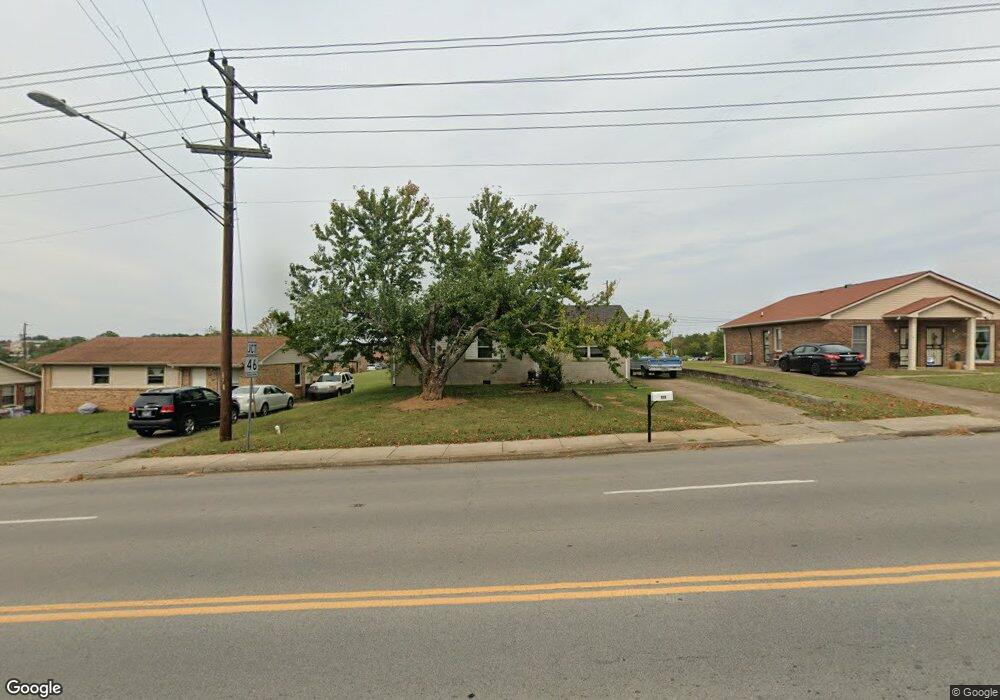
909 E Walnut St Dickson, TN 37055
Estimated Value: $162,000 - $257,000
Studio
1
Bath
1,050
Sq Ft
$206/Sq Ft
Est. Value
About This Home
This home is located at 909 E Walnut St, Dickson, TN 37055 and is currently estimated at $216,670, approximately $206 per square foot. 909 E Walnut St is a home located in Dickson County with nearby schools including Oakmont Elementary School, Dickson Middle School, and Dickson County High School.
Ownership History
Date
Name
Owned For
Owner Type
Purchase Details
Closed on
May 24, 2012
Sold by
Wright Brandon Edward
Bought by
Adams Mack J
Current Estimated Value
Home Financials for this Owner
Home Financials are based on the most recent Mortgage that was taken out on this home.
Original Mortgage
$51,000
Outstanding Balance
$35,302
Interest Rate
3.88%
Mortgage Type
Commercial
Estimated Equity
$181,368
Purchase Details
Closed on
Feb 11, 2008
Sold by
Felts Joel Wesley
Bought by
Wright Brandon E
Purchase Details
Closed on
Mar 30, 2007
Sold by
Felts Joel Wesley
Bought by
Pulse Don S
Purchase Details
Closed on
May 27, 1997
Sold by
Goodfred George E And
Bought by
Felts Joel and Felts Linda
Purchase Details
Closed on
Nov 20, 1992
Bought by
Goodfred George E and Goodfred Joel Wesle
Purchase Details
Closed on
Oct 8, 1976
Bought by
Kelly Tom L and Kelly Francis M
Create a Home Valuation Report for This Property
The Home Valuation Report is an in-depth analysis detailing your home's value as well as a comparison with similar homes in the area
Home Values in the Area
Average Home Value in this Area
Purchase History
| Date | Buyer | Sale Price | Title Company |
|---|---|---|---|
| Adams Mack J | $50,000 | -- | |
| Wright Brandon E | $52,500 | -- | |
| Pulse Don S | $74,000 | -- | |
| Kimbro Cody D | -- | -- | |
| Felts Joel | -- | -- | |
| Goodfred George E | $25,500 | -- | |
| Kelly Tom L | -- | -- |
Source: Public Records
Mortgage History
| Date | Status | Borrower | Loan Amount |
|---|---|---|---|
| Open | Adams Mack J | $51,000 |
Source: Public Records
Tax History
| Year | Tax Paid | Tax Assessment Tax Assessment Total Assessment is a certain percentage of the fair market value that is determined by local assessors to be the total taxable value of land and additions on the property. | Land | Improvement |
|---|---|---|---|---|
| 2025 | -- | $40,300 | $7,475 | $32,825 |
| 2024 | -- | $40,300 | $7,475 | $32,825 |
| 2023 | $841 | $26,950 | $3,175 | $23,775 |
| 2022 | $841 | $26,950 | $3,175 | $23,775 |
| 2021 | $836 | $26,950 | $3,175 | $23,775 |
| 2020 | $836 | $26,750 | $3,175 | $23,575 |
| 2019 | $836 | $26,750 | $3,175 | $23,575 |
| 2018 | $670 | $18,375 | $3,000 | $15,375 |
| 2017 | $670 | $18,375 | $3,000 | $15,375 |
| 2016 | $670 | $18,375 | $3,000 | $15,375 |
| 2015 | $615 | $15,850 | $3,000 | $12,850 |
| 2014 | $615 | $15,850 | $3,000 | $12,850 |
Source: Public Records
Map
Nearby Homes
- 501 Caraway Ct
- 161 Caraway Ct
- 101 Sunset Rd
- 211 W Hills Terrace
- 101 Birch St
- 101 W Hills Terrace
- 1103 Cowan Rd
- 1087 Cowan Rd
- 0 Highway 46 Unit RTC2944647
- 1003 Autumnwood Dr
- 0 Henslee Dr Spring St Unit RTC3128657
- 211 Sandalwood Way
- 213 Sandalwood Way
- 209 Sandalwood Way
- 402 Cottage Ln
- 422 Shady Hill Rd
- 500 Church St
- 501 High St Unit A
- 404 Cottage Ln
- 405 Cottage Ln
- 907 E Walnut St
- 333 E Walnut St
- 905 E Walnut St
- 208 Martin Luther King jr Blvd
- 210 Martin Luther King jr Blvd
- 204 Martin Luther King jr Blvd
- 206 Martin Luther King jr Blvd
- 202 Martin Luther King jr Blvd
- 901 E Walnut St
- 300 Martin Luther King jr Blvd
- 1003 E Walnut St
- 914 Highway 47 E
- 100 Suggs St
- 801 E Railroad St
- 302 Martin Luther King jr Blvd
- 200 Martin Luther King jr Blvd
- 1005 E Walnut St
- 1004 Highway 47 E
- 102 Suggs St
- 800 E Railroad St
Your Personal Tour Guide
Ask me questions while you tour the home.