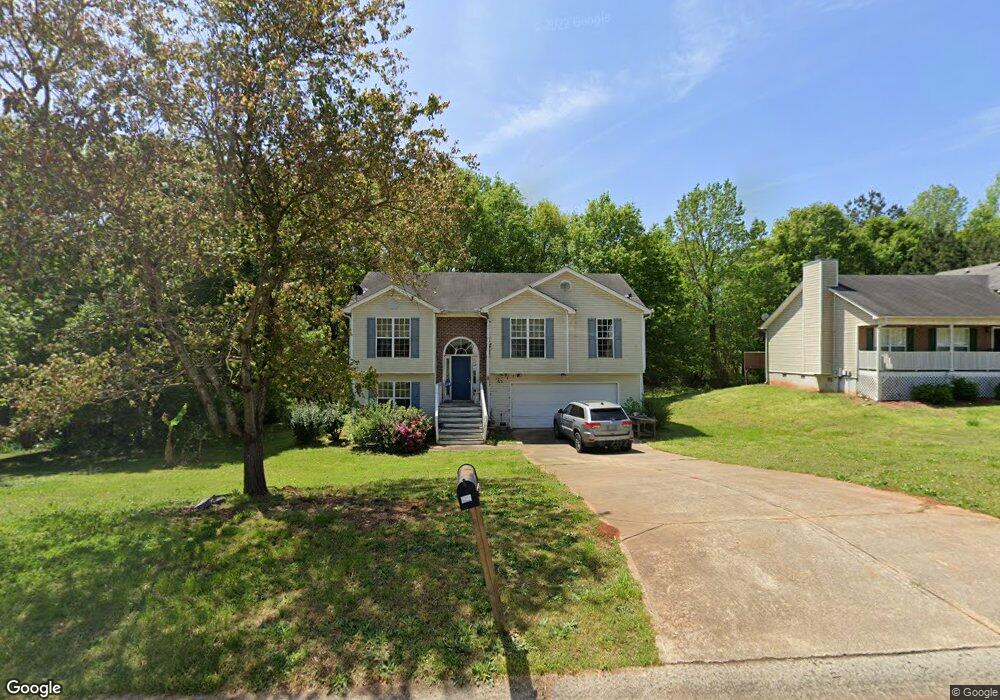
909 Nature Trail Unit 2 Bethlehem, GA 30620
Estimated Value: $288,584 - $332,000
3
Beds
2
Baths
1,599
Sq Ft
$196/Sq Ft
Est. Value
About This Home
This home is located at 909 Nature Trail Unit 2, Bethlehem, GA 30620 and is currently estimated at $312,896, approximately $195 per square foot. 909 Nature Trail Unit 2 is a home located in Barrow County with nearby schools including Yargo Elementary School, Haymon-Morris Middle School, and Apalachee High School.
Ownership History
Date
Name
Owned For
Owner Type
Purchase Details
Closed on
Nov 7, 2008
Sold by
Hud-Housing Of Urban Dev
Bought by
Pichan Ronald D
Current Estimated Value
Home Financials for this Owner
Home Financials are based on the most recent Mortgage that was taken out on this home.
Original Mortgage
$103,500
Interest Rate
6.38%
Purchase Details
Closed on
Apr 1, 2008
Sold by
National City Real Est Svcs Ll
Bought by
Hud-Housing Of Urban Dev
Purchase Details
Closed on
Dec 20, 2002
Sold by
Star Hm Builders Inc
Bought by
Lang James C
Home Financials for this Owner
Home Financials are based on the most recent Mortgage that was taken out on this home.
Original Mortgage
$121,985
Interest Rate
5.99%
Mortgage Type
FHA
Purchase Details
Closed on
Jul 19, 2002
Sold by
Parkview Development
Bought by
Star Home Builders I
Purchase Details
Closed on
May 2, 2000
Bought by
Parkview Development
Create a Home Valuation Report for This Property
The Home Valuation Report is an in-depth analysis detailing your home's value as well as a comparison with similar homes in the area
Home Values in the Area
Average Home Value in this Area
Purchase History
| Date | Buyer | Sale Price | Title Company |
|---|---|---|---|
| Pichan Ronald D | -- | -- | |
| Hud-Housing Of Urban Dev | -- | -- | |
| National City Real Est Svcs Ll | -- | -- | |
| Lang James C | $123,900 | -- | |
| Star Home Builders I | $280,000 | -- | |
| Parkview Development | -- | -- |
Source: Public Records
Mortgage History
| Date | Status | Borrower | Loan Amount |
|---|---|---|---|
| Closed | Pichan Ronald D | $103,500 | |
| Previous Owner | Lang James C | $121,985 |
Source: Public Records
Tax History Compared to Growth
Tax History
| Year | Tax Paid | Tax Assessment Tax Assessment Total Assessment is a certain percentage of the fair market value that is determined by local assessors to be the total taxable value of land and additions on the property. | Land | Improvement |
|---|---|---|---|---|
| 2024 | $1,182 | $99,710 | $25,200 | $74,510 |
| 2023 | $790 | $100,110 | $25,200 | $74,910 |
| 2022 | $744 | $75,365 | $20,000 | $55,365 |
| 2021 | $692 | $65,868 | $16,000 | $49,868 |
| 2020 | $598 | $58,540 | $16,000 | $42,540 |
| 2019 | $623 | $58,540 | $16,000 | $42,540 |
| 2018 | $1,223 | $55,740 | $13,200 | $42,540 |
| 2017 | $1,389 | $47,712 | $13,200 | $34,512 |
| 2016 | $829 | $43,203 | $13,200 | $30,003 |
| 2015 | $842 | $43,540 | $13,200 | $30,340 |
| 2014 | $302 | $37,144 | $6,468 | $30,676 |
| 2013 | -- | $35,650 | $6,468 | $29,182 |
Source: Public Records
Map
Nearby Homes
- 637 Sleeping Meadow Ln
- 0 Tanners Bridge Rd Unit 10588144
- 286 Meadows Dr
- 763 Moss Side Dr
- 0 Jb Owens Unit 7552902
- 0 Jb Owens Unit 7552891
- 0 Jb Owens Unit LOT 2 - 2.09 ACRES
- 0 Jb Owens Unit LOT 3 - 2.01 ACRES
- 103 Camp Ct
- 384 Winslow Ct
- 1071 Covenant Ct
- 303 Ron Dr
- 1129 Loganville Hwy
- 209 Angie Way
- 190 Lokeys Ln
- 934 Beaver Hill Dr
- 1111 Otis Dr
- 1381 Loganville Hwy
- 840 N Cross Lane Rd
- 758 Clarence Edwards Rd
- 907 Nature Trail
- 911 Nature Trail Unit 2
- 905 Nature Trail
- 913 Nature Trail
- 913 Nature Trail Unit 2
- 0 Nature Trail Unit 8112494
- 0 Nature Trail Unit 8040920
- 0 Nature Trail Unit 8372952
- 0 Nature Trail Unit 9072552
- 0 Nature Trail Unit 3135924
- 0 Nature Trail Unit 7267839
- 0 Nature Trail
- 903 Nature Trail
- 910 Nature Trail Unit 27
- 910 Nature Trail
- 915 Nature Trail Unit Two
- 915 Nature Trail
- 912 Nature Trail Unit 2
- 906 Nature Trail Unit Two
- 906 Nature Trail