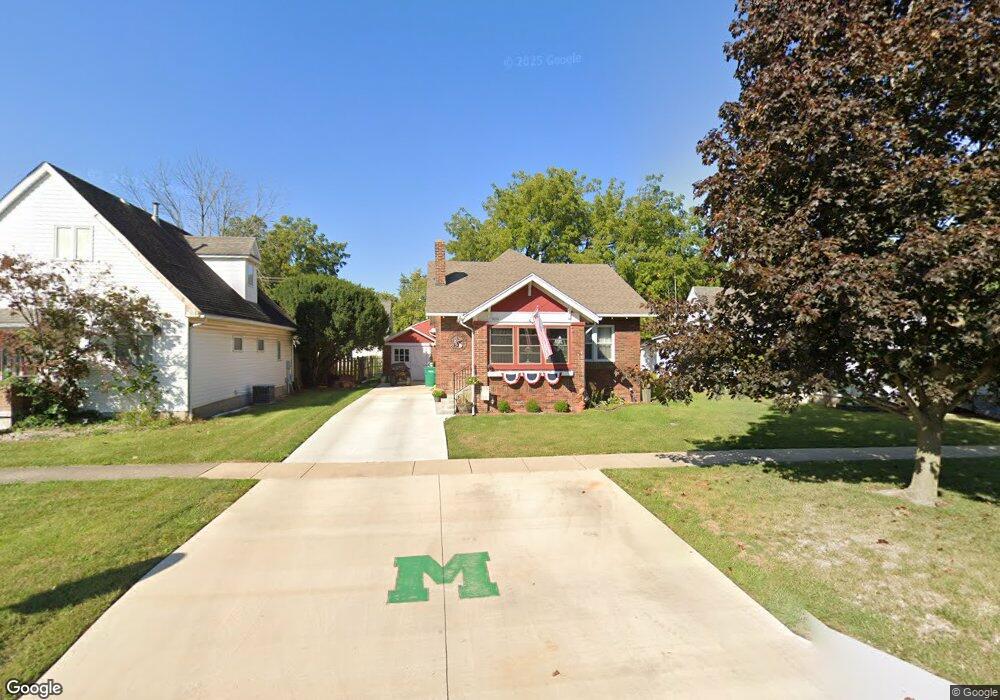
909 S 14th St Mattoon, IL 61938
Estimated Value: $155,000 - $177,669
6
Beds
6
Baths
4,056
Sq Ft
$41/Sq Ft
Est. Value
About This Home
This home is located at 909 S 14th St, Mattoon, IL 61938 and is currently estimated at $167,167, approximately $41 per square foot. 909 S 14th St is a home located in Coles County with nearby schools including Mattoon High School, St Mary School, and St. John's Lutheran School.
Ownership History
Date
Name
Owned For
Owner Type
Purchase Details
Closed on
Mar 31, 2016
Sold by
Eaton Jeffrey M
Bought by
Tucker Jason L
Current Estimated Value
Home Financials for this Owner
Home Financials are based on the most recent Mortgage that was taken out on this home.
Original Mortgage
$83,000
Outstanding Balance
$66,368
Interest Rate
3.88%
Mortgage Type
VA
Estimated Equity
$100,799
Purchase Details
Closed on
Mar 5, 2014
Sold by
First Mid Illinois Bank & Trust Na
Bought by
Eaton Jeffrey M
Home Financials for this Owner
Home Financials are based on the most recent Mortgage that was taken out on this home.
Original Mortgage
$150,000
Interest Rate
4.75%
Mortgage Type
New Conventional
Purchase Details
Closed on
May 10, 2005
Sold by
Komada Elaine Karpus and Estate Of Jon C Dearnbarger
Bought by
Dearnbarger Kurt M
Home Financials for this Owner
Home Financials are based on the most recent Mortgage that was taken out on this home.
Original Mortgage
$122,400
Interest Rate
5.93%
Mortgage Type
Construction
Create a Home Valuation Report for This Property
The Home Valuation Report is an in-depth analysis detailing your home's value as well as a comparison with similar homes in the area
Home Values in the Area
Average Home Value in this Area
Purchase History
| Date | Buyer | Sale Price | Title Company |
|---|---|---|---|
| Tucker Jason L | -- | -- | |
| Eaton Jeffrey M | $91,000 | -- | |
| Dearnbarger Kurt M | $50,500 | None Available |
Source: Public Records
Mortgage History
| Date | Status | Borrower | Loan Amount |
|---|---|---|---|
| Open | Tucker Jason L | $83,000 | |
| Previous Owner | Eaton Jeffrey M | $150,000 | |
| Previous Owner | Dearnbarger Kurt M | $122,400 |
Source: Public Records
Tax History Compared to Growth
Tax History
| Year | Tax Paid | Tax Assessment Tax Assessment Total Assessment is a certain percentage of the fair market value that is determined by local assessors to be the total taxable value of land and additions on the property. | Land | Improvement |
|---|---|---|---|---|
| 2024 | $2,576 | $44,949 | $2,541 | $42,408 |
| 2023 | $2,576 | $40,133 | $2,269 | $37,864 |
| 2022 | $2,490 | $39,470 | $2,232 | $37,238 |
| 2021 | $2,458 | $36,254 | $3,856 | $32,398 |
| 2020 | $2,422 | $37,563 | $3,995 | $33,568 |
| 2019 | $2,348 | $36,254 | $3,856 | $32,398 |
| 2018 | $2,308 | $36,254 | $3,856 | $32,398 |
| 2017 | $2,300 | $36,254 | $3,856 | $32,398 |
| 2016 | $3,233 | $36,254 | $3,856 | $32,398 |
| 2015 | $2,666 | $36,254 | $3,856 | $32,398 |
| 2014 | $2,666 | $36,254 | $3,856 | $32,398 |
| 2013 | $2,666 | $36,254 | $3,856 | $32,398 |
Source: Public Records
Map
Nearby Homes
- 900 S 14th St
- 1009 S 14th St
- 1017 S 14th St
- 1305 Marshall Ave
- 1613 Marshall Ave
- 1701 Marshall Ave
- 1005 Lake Land Blvd
- 1616 Marshall Ave
- 1100 Marshall Ave
- 1208 S 12th St
- 1509 Lafayette Ave
- 1821 Dakota Ave
- 1001 Wabash Ave
- 705 Marion Ave
- 613 S 7th St
- 720 Edgar Ave
- 905 S 23rd St
- 1120 Broadway Ave
- 609 Lafayette Ave
- 716 S 24th St