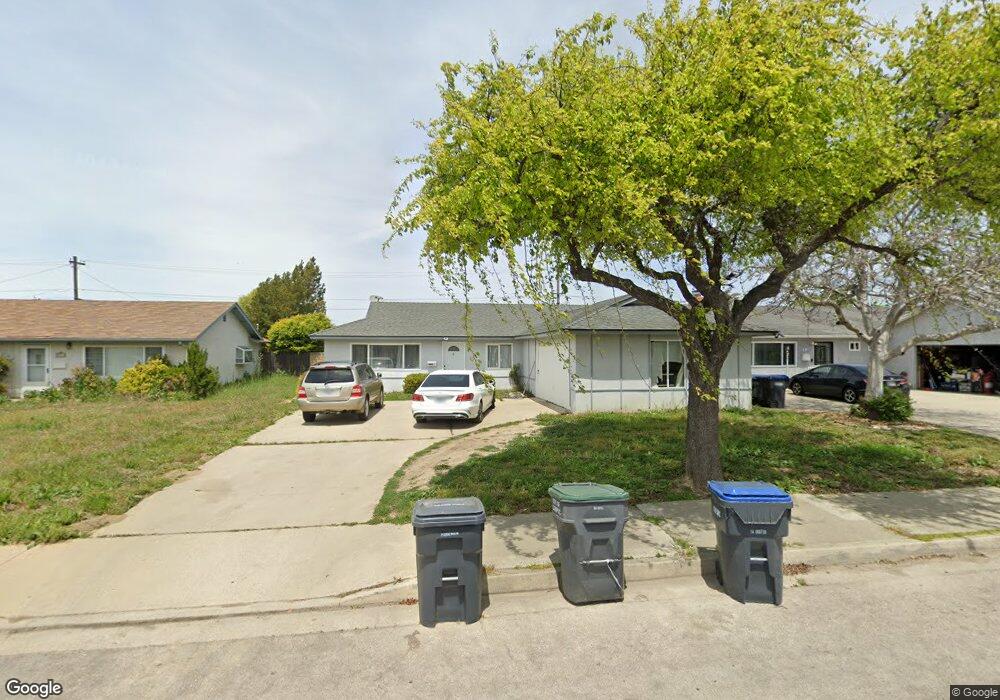
909 W Anthony Way Lompoc, CA 93436
West Lompoc NeighborhoodEstimated Value: $548,751 - $672,000
4
Beds
2
Baths
6,534
Sq Ft
$91/Sq Ft
Est. Value
About This Home
This home is located at 909 W Anthony Way, Lompoc, CA 93436 and is currently estimated at $596,188, approximately $91 per square foot. 909 W Anthony Way is a home located in Santa Barbara County with nearby schools including La Canada Elementary School, Lompoc Valley Middle School, and Lompoc High School.
Ownership History
Date
Name
Owned For
Owner Type
Purchase Details
Closed on
Nov 7, 2019
Sold by
Paymani Ali
Bought by
Paymani Ali and Hejazi Shiva
Current Estimated Value
Purchase Details
Closed on
Aug 30, 2019
Sold by
Hejazi Shiva
Bought by
Paymani Ali
Purchase Details
Closed on
Aug 27, 2019
Sold by
Rubio Andres
Bought by
Paymani Ali
Purchase Details
Closed on
Oct 15, 2004
Sold by
Cochran Lawrence A and Howard Myra Tilda
Bought by
Rubio Andres
Home Financials for this Owner
Home Financials are based on the most recent Mortgage that was taken out on this home.
Original Mortgage
$351,200
Interest Rate
6.25%
Mortgage Type
Purchase Money Mortgage
Purchase Details
Closed on
Apr 8, 2003
Sold by
Gilbertson Carroll L
Bought by
Cochran Lawrence A and Howard Myra Tilda
Create a Home Valuation Report for This Property
The Home Valuation Report is an in-depth analysis detailing your home's value as well as a comparison with similar homes in the area
Home Values in the Area
Average Home Value in this Area
Purchase History
| Date | Buyer | Sale Price | Title Company |
|---|---|---|---|
| Paymani Ali | -- | None Available | |
| Paymani Ali | -- | First American Title Company | |
| Paymani Ali | $335,000 | First American Title Company | |
| Rubio Andres | $439,000 | Stewart Title Of Ca Inc | |
| Cochran Lawrence A | $230,000 | Stewart Title Of Ca Inc |
Source: Public Records
Mortgage History
| Date | Status | Borrower | Loan Amount |
|---|---|---|---|
| Previous Owner | Rubio Andres | $351,200 | |
| Closed | Rubio Andres | $87,800 |
Source: Public Records
Tax History Compared to Growth
Tax History
| Year | Tax Paid | Tax Assessment Tax Assessment Total Assessment is a certain percentage of the fair market value that is determined by local assessors to be the total taxable value of land and additions on the property. | Land | Improvement |
|---|---|---|---|---|
| 2025 | $4,000 | $366,366 | $109,362 | $257,004 |
| 2023 | $4,000 | $352,141 | $105,116 | $247,025 |
| 2022 | $3,931 | $345,237 | $103,055 | $242,182 |
| 2021 | $3,975 | $338,469 | $101,035 | $237,434 |
| 2020 | $3,933 | $335,000 | $100,000 | $235,000 |
| 2019 | $3,433 | $291,000 | $132,000 | $159,000 |
| 2018 | $3,283 | $277,000 | $126,000 | $151,000 |
| 2017 | $3,134 | $264,000 | $120,000 | $144,000 |
| 2016 | $2,857 | $240,000 | $109,000 | $131,000 |
| 2014 | $2,633 | $218,000 | $99,000 | $119,000 |
Source: Public Records
Map
Nearby Homes
- 906 N P St
- 816 N O St Unit 113
- 905 N L St
- 1241 Stonebrook Dr
- 1265 Stonebrook Dr
- 321 W North Ave Unit 49
- 1320 Stonebrook Dr
- 1121 Bellflower Ln
- 1236 Jason Dr
- 1429 Glen Ellen Ln
- 531 N O St
- 1212 W Prune Ave
- 1317 N V St Unit 182
- 1317 N V St Unit 76
- 1407 N H St
- 1006 Tranquillion Ct
- 100 California 1
- 510 N I St
- 1104 Honda Way
- 1426 Plum Ave