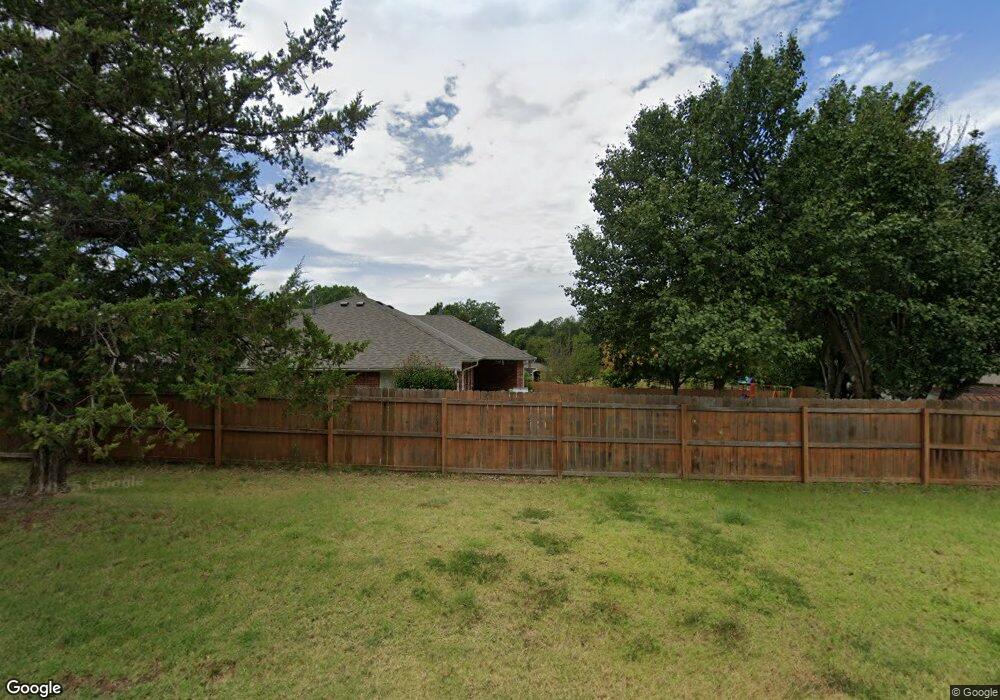
909 Woodbrook Dr Purcell, OK 73080
Estimated Value: $313,000 - $334,579
4
Beds
3
Baths
1,987
Sq Ft
$166/Sq Ft
Est. Value
About This Home
This home is located at 909 Woodbrook Dr, Purcell, OK 73080 and is currently estimated at $328,895, approximately $165 per square foot. 909 Woodbrook Dr is a home located in McClain County with nearby schools including Purcell Elementary School, Purcell Intermediate School, and Purcell Junior High School.
Ownership History
Date
Name
Owned For
Owner Type
Purchase Details
Closed on
Aug 10, 2022
Sold by
Wilkes and Stacey
Bought by
Idlett Kimberly and Idlett Justin
Current Estimated Value
Home Financials for this Owner
Home Financials are based on the most recent Mortgage that was taken out on this home.
Original Mortgage
$214,000
Outstanding Balance
$203,962
Interest Rate
5.3%
Mortgage Type
New Conventional
Estimated Equity
$124,933
Purchase Details
Closed on
Apr 1, 2022
Sold by
Ann Bell Teresa and Ann Wayne Gary
Bought by
Wilkes Gregg and Wilkes Stacey
Home Financials for this Owner
Home Financials are based on the most recent Mortgage that was taken out on this home.
Original Mortgage
$196,808
Interest Rate
4.67%
Mortgage Type
New Conventional
Purchase Details
Closed on
Jul 3, 2001
Sold by
Maynard Ronnie and Maynard Nancy
Bought by
Wilson William and Wilson Melissa
Create a Home Valuation Report for This Property
The Home Valuation Report is an in-depth analysis detailing your home's value as well as a comparison with similar homes in the area
Home Values in the Area
Average Home Value in this Area
Purchase History
| Date | Buyer | Sale Price | Title Company |
|---|---|---|---|
| Idlett Kimberly | $305,000 | First American Title | |
| Wilkes Gregg | -- | Stewart Title Company | |
| Wilson William | $147,100 | -- |
Source: Public Records
Mortgage History
| Date | Status | Borrower | Loan Amount |
|---|---|---|---|
| Open | Idlett Kimberly | $214,000 | |
| Previous Owner | Wilkes Gregg | $196,808 |
Source: Public Records
Tax History Compared to Growth
Tax History
| Year | Tax Paid | Tax Assessment Tax Assessment Total Assessment is a certain percentage of the fair market value that is determined by local assessors to be the total taxable value of land and additions on the property. | Land | Improvement |
|---|---|---|---|---|
| 2025 | $3,645 | $33,672 | $4,620 | $29,052 |
| 2024 | $3,645 | $33,549 | $4,620 | $28,929 |
| 2023 | $3,645 | $33,550 | $2,523 | $31,027 |
| 2022 | $2,035 | $19,951 | $2,788 | $17,163 |
| 2021 | $2,060 | $19,951 | $3,093 | $16,858 |
| 2020 | $2,040 | $19,951 | $3,093 | $16,858 |
| 2019 | $2,077 | $19,952 | $2,724 | $17,228 |
| 2018 | $2,065 | $19,001 | $2,912 | $16,089 |
| 2017 | $1,921 | $18,096 | $2,889 | $15,207 |
| 2016 | $1,852 | $17,234 | $2,852 | $14,382 |
| 2015 | $1,792 | $16,414 | $2,558 | $13,856 |
| 2014 | $1,690 | $15,632 | $2,200 | $13,432 |
Source: Public Records
Map
Nearby Homes
- 2907 Ridgecrest Dr
- 2915 Ridgecrest Dr
- 2907 Blue Stem Ct
- 0 Bluestem Ct
- 0 Sage Ct
- 0 Eagles Nest Unit 1152121
- 817 Carrie Ct
- 0 Bella Ct Unit 1156845
- 0 Bella Ct Unit 1156680
- 3116 Thousand Oaks Dr
- 2115 N 9th Ave
- 3534 N 9th Ave
- 937 Luglena Ln
- 22453 State Highway 74
- 22455 State Highway 74
- 0000 N Green Ave
- 1027 W Windsor Way
- 1203 Mayes St
- 1068 Westbrook Blvd
- 1064 Westbrook Blvd
- 907 Woodbrook Dr
- 908 Woodbrook Dr
- 919 Woodbrook Dr
- 917 Woodbrook Dr
- 906 Woodbrook Dr
- 933 Woodbrook Dr
- 918 Woodbrook Dr
- 2726 Northridge Cir
- 928 Woodbrook Dr
- 935 Woodbrook Dr
- 935 Woodbrook Dr
- 1013 Woodbrook Dr
- 0 Woodbrook Dr
- 901 Feland Dr
- 903 Feland Dr
- 934 Woodbrook Dr
- 916 Woodbrook Blvd
- 1005 Woodbrook Dr
- 2727 Northridge Cir
- 978 Woodbrook Blvd