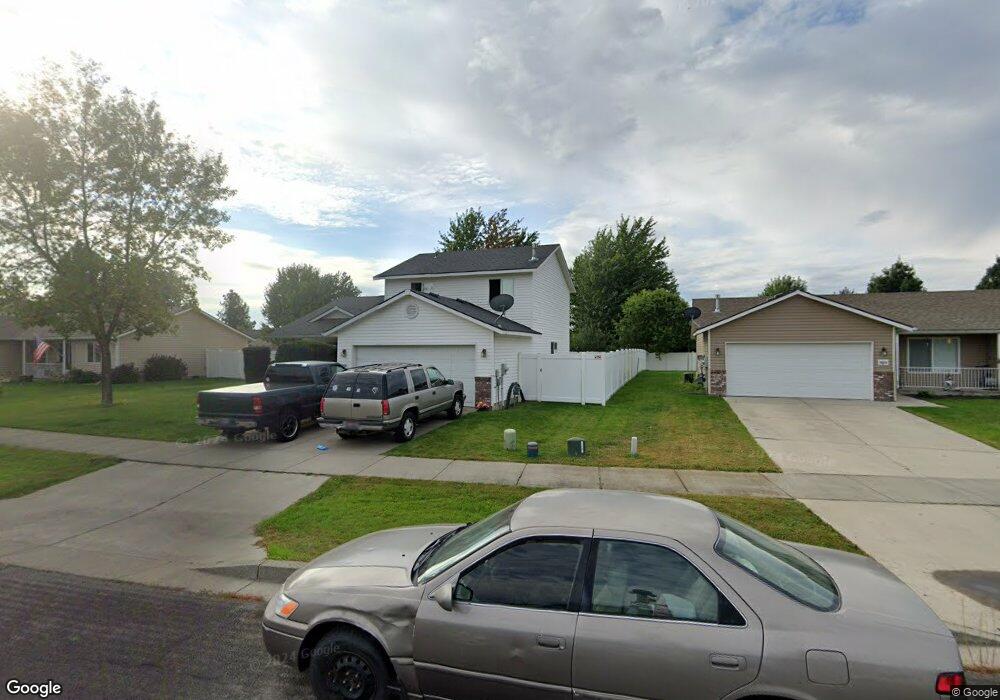
9090 N Torrey Ln Hayden, ID 83835
Estimated Value: $467,000 - $534,000
4
Beds
2
Baths
1,472
Sq Ft
$336/Sq Ft
Est. Value
About This Home
This home is located at 9090 N Torrey Ln, Hayden, ID 83835 and is currently estimated at $494,305, approximately $335 per square foot. 9090 N Torrey Ln is a home located in Kootenai County with nearby schools including Atlas Elementary School, Woodland Middle School, and Coeur d'Alene High School.
Ownership History
Date
Name
Owned For
Owner Type
Purchase Details
Closed on
Oct 4, 2024
Sold by
Skog 2 Llc
Bought by
Scandia 9 Torrey Llc
Current Estimated Value
Purchase Details
Closed on
Aug 2, 2018
Sold by
Scandia Properties Llc
Bought by
Skog 2 Llc
Purchase Details
Closed on
Mar 5, 2015
Sold by
Lindskog Suzanne
Bought by
Scandia Properties Llc
Purchase Details
Closed on
Aug 21, 2014
Sold by
Rowlands Andrew and Rowlands Julie
Bought by
Lindskog Suzenne and The Suzanne Lindskog Trust
Purchase Details
Closed on
Nov 5, 2011
Sold by
Rowlands Andrew and Rowlands Julie
Bought by
Rowlands Andrew and Rowlands Julie
Home Financials for this Owner
Home Financials are based on the most recent Mortgage that was taken out on this home.
Original Mortgage
$102,300
Interest Rate
3.36%
Mortgage Type
New Conventional
Create a Home Valuation Report for This Property
The Home Valuation Report is an in-depth analysis detailing your home's value as well as a comparison with similar homes in the area
Home Values in the Area
Average Home Value in this Area
Purchase History
| Date | Buyer | Sale Price | Title Company |
|---|---|---|---|
| Scandia 9 Torrey Llc | -- | Title One | |
| Skog 2 Llc | -- | Accommodation | |
| Scandia Properties Llc | -- | Alliance Title | |
| Lindskog Suzenne | -- | Alliance Title | |
| Rowlands Andrew | -- | None Available | |
| Rowlands Andrew | -- | None Available |
Source: Public Records
Mortgage History
| Date | Status | Borrower | Loan Amount |
|---|---|---|---|
| Previous Owner | Rowlands Andrew | $102,300 |
Source: Public Records
Tax History Compared to Growth
Tax History
| Year | Tax Paid | Tax Assessment Tax Assessment Total Assessment is a certain percentage of the fair market value that is determined by local assessors to be the total taxable value of land and additions on the property. | Land | Improvement |
|---|---|---|---|---|
| 2025 | $1,917 | $426,220 | $195,000 | $231,220 |
| 2024 | $1,917 | $411,530 | $180,000 | $231,530 |
| 2023 | $1,917 | $423,107 | $180,000 | $243,107 |
| 2022 | $2,023 | $468,575 | $200,000 | $268,575 |
| 2021 | $2,163 | $307,695 | $125,000 | $182,695 |
| 2020 | $2,090 | $261,592 | $100,000 | $161,592 |
| 2019 | $2,111 | $242,887 | $96,800 | $146,087 |
| 2018 | $2,089 | $214,590 | $88,000 | $126,590 |
| 2017 | $1,971 | $188,420 | $65,000 | $123,420 |
| 2016 | $1,881 | $172,340 | $57,500 | $114,840 |
| 2015 | $903 | $161,090 | $46,000 | $115,090 |
| 2013 | $1,840 | $153,490 | $36,800 | $116,690 |
Source: Public Records
Map
Nearby Homes
- 9451 N Chateaux Dr
- 9481 N Chateaux Dr
- 2518 W Ashland Ln
- 2114 Boyles
- 9099 N Ramsgate Ln
- 3034 W Ashland Ln
- 3260 W Magistrate Loop
- 8849 N Torrey Ln
- 9178 N Entiate Dr
- 1751 Hayden
- 8747 Salmonberry
- 3294 W Giovanni Ln
- 9433 N Justice Way
- 2885 Mulberry Ct
- 8303 Salmonberry
- 3450 W Hayden Ave
- 8964 N Handler Dr
- 9569 N Prince William Loop
- 8705 N Ramsey Rd
- Lot 6 Blk 1 Tamarindo Ln
- 9084 N Torrey Ln
- 9098 Torrey Ln
- 9096 N Torrey Ln
- 9102 N Torrey Ln
- 9078 N Torrey Ln
- 2427 W Sheffield Trail
- 2449 W Sheffield Trail
- 9091 Torrey Ln
- 9085 N Torrey Ln
- 2405 W Sheffield Trail
- 9097 N Torrey Ln
- 9072 N Torrey Ln
- 9079 N Torrey Ln
- 9114 N Torrey Ln
- 2383 W Sheffield Trail
- 2487 W Sheffield Trail
- 9073 N Torrey Ln
- 9068 N Torrey Ln
- 9109 N Torrey Ln
- 2494 Hayden Ave