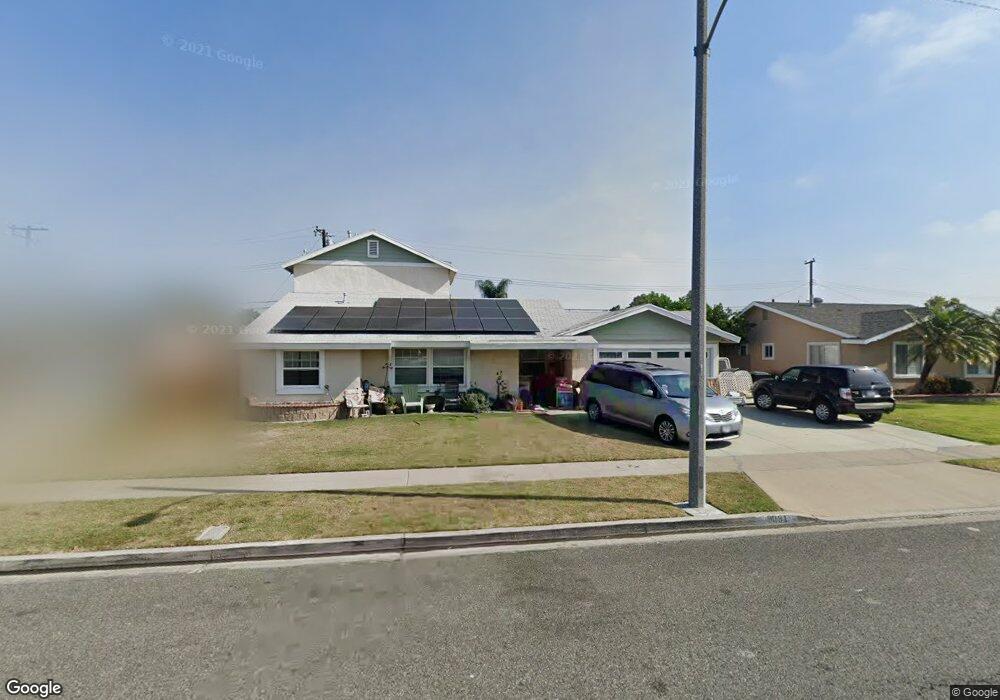
9091 Mays Ave Garden Grove, CA 92844
Estimated Value: $1,182,000 - $1,293,477
3
Beds
3
Baths
2,722
Sq Ft
$462/Sq Ft
Est. Value
About This Home
This home is located at 9091 Mays Ave, Garden Grove, CA 92844 and is currently estimated at $1,257,119, approximately $461 per square foot. 9091 Mays Ave is a home located in Orange County with nearby schools including Cook Elementary School, Donald S. Jordan Intermediate School, and Bolsa Grande High School.
Ownership History
Date
Name
Owned For
Owner Type
Purchase Details
Closed on
Jan 9, 2015
Sold by
Nelson James H
Bought by
Nelson James H and Nelson Julie D
Current Estimated Value
Purchase Details
Closed on
Oct 20, 2010
Sold by
Nelson Julie D
Bought by
Nelson James H
Home Financials for this Owner
Home Financials are based on the most recent Mortgage that was taken out on this home.
Original Mortgage
$407,539
Interest Rate
4.5%
Mortgage Type
FHA
Purchase Details
Closed on
Oct 30, 2009
Sold by
Nelson James H
Bought by
Nelson James H and Nelson Julie D
Purchase Details
Closed on
May 15, 2009
Sold by
Nelson Julie D
Bought by
Nelson James H
Home Financials for this Owner
Home Financials are based on the most recent Mortgage that was taken out on this home.
Original Mortgage
$407,000
Interest Rate
4.82%
Mortgage Type
FHA
Create a Home Valuation Report for This Property
The Home Valuation Report is an in-depth analysis detailing your home's value as well as a comparison with similar homes in the area
Home Values in the Area
Average Home Value in this Area
Purchase History
| Date | Buyer | Sale Price | Title Company |
|---|---|---|---|
| Nelson James H | -- | None Available | |
| Nelson James H | -- | Old Republic Title Company | |
| Nelson James H | -- | Nations Title Company | |
| Nelson James H | -- | Nations Title |
Source: Public Records
Mortgage History
| Date | Status | Borrower | Loan Amount |
|---|---|---|---|
| Closed | Nelson James H | $407,539 | |
| Closed | Nelson James H | $407,000 |
Source: Public Records
Tax History Compared to Growth
Tax History
| Year | Tax Paid | Tax Assessment Tax Assessment Total Assessment is a certain percentage of the fair market value that is determined by local assessors to be the total taxable value of land and additions on the property. | Land | Improvement |
|---|---|---|---|---|
| 2025 | $4,340 | $345,693 | $142,135 | $203,558 |
| 2024 | $4,340 | $338,915 | $139,348 | $199,567 |
| 2023 | $4,257 | $332,270 | $136,616 | $195,654 |
| 2022 | $4,164 | $325,755 | $133,937 | $191,818 |
| 2021 | $10,903 | $319,368 | $131,311 | $188,057 |
| 2020 | $10,803 | $316,094 | $129,965 | $186,129 |
| 2019 | $10,726 | $309,897 | $127,417 | $182,480 |
| 2018 | $10,641 | $303,821 | $124,919 | $178,902 |
| 2017 | $10,566 | $297,864 | $122,469 | $175,395 |
| 2016 | $10,379 | $292,024 | $120,068 | $171,956 |
| 2015 | $10,337 | $287,638 | $118,264 | $169,374 |
| 2014 | $3,525 | $282,004 | $115,947 | $166,057 |
Source: Public Records
Map
Nearby Homes
- 13839 Magnolia St
- 13411 Magnolia St
- 13392 Magnolia St
- 13392 Lucille St
- 8784 Hewitt Place Unit 12
- 9200 Westminster Blvd Unit 25
- 8866 Grandville Cir
- 13782 Newland St
- 13100 Gilbert St Unit 28
- 9370 W Garden Grove Blvd
- 8833 Brookdale Dr
- 8442 Trask Ave
- 13252 Newland St Unit A-D
- 8741 Jennrich Ave
- 13175 Creek View Dr Unit F
- 8520 Lake Knoll Ave Unit B
- 9691 Central Ave
- 9651 Crosby Ave
- 8800 Garden Grove Blvd Unit 2
- 12861 Alamitos Way
- 9081 Mays Ave
- 9101 Mays Ave
- 9082 Enloe Way
- 9092 Enloe Way
- 9072 Enloe Way
- 9111 Mays Ave
- 13682 Yoak St
- 13691 Linnert St
- 13672 Yoak St
- 9102 Enloe Way
- 13682 Linnert St
- 13652 Yoak St
- 9121 Mays Ave
- 13702 Yoak St
- 9112 Enloe Way
- 13692 Linnert St
- 13711 Linnert St
- 13681 La Vaughn Dr
- 9071 Enloe Way
- 13712 Yoak St