T
Landlord's Agent in 2013
Thomas Dimaggio
CAH Realty Nevada LLC
Estimated Value: $414,000 - $458,000
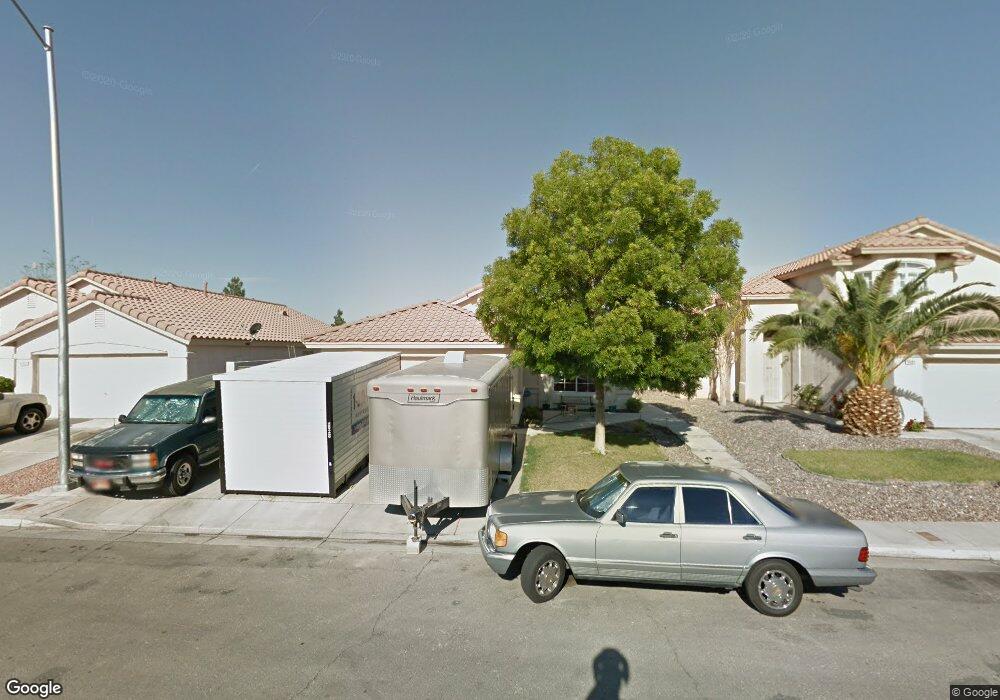
This home is located at 9099 Lava Bluff Ct Unit B, Las Vegas, NV 89123 since 21 June 2013 and is currently priced at $434,482. This property was built in 1998. 9099 Lava Bluff Ct Unit B is a home located in Clark County with nearby schools including Roberta C Cartwright Elementary School, Charles Silvestri Junior High School, and Silverado High School.
Last Agent to Rent the Property
Thomas Dimaggio
CAH Realty Nevada LLC License #S.0171569 Listed on: 06/21/2013
Last Renter's Agent
Thomas Dimaggio
CAH Realty Nevada LLC License #S.0171569 Listed on: 06/21/2013
| Date | Buyer | Sale Price | Title Company |
|---|---|---|---|
| Freo Nevada Llc | $150,000 | Fidelity National Title Las | |
| Duffy Jun F | -- | Fidelity National Title Las | |
| Duffy Jun F | $139,900 | Old Republic Title Company | |
| Martin Felicia R | $117,000 | United Title |
| Date | Status | Borrower | Loan Amount |
|---|---|---|---|
| Previous Owner | Duffy Jun F | $136,923 | |
| Previous Owner | Martin Felicia R | $115,066 |
| Date | Event | Price | List to Sale | Price per Sq Ft |
|---|---|---|---|---|
| 06/21/2013 06/21/13 | For Rent | $1,150 | 0.0% | -- |
| 06/21/2013 06/21/13 | Rented | $1,150 | -- | -- |
| Year | Tax Paid | Tax Assessment Tax Assessment Total Assessment is a certain percentage of the fair market value that is determined by local assessors to be the total taxable value of land and additions on the property. | Land | Improvement |
|---|---|---|---|---|
| 2025 | $2,303 | $95,020 | $35,000 | $60,020 |
| 2024 | $2,133 | $95,020 | $35,000 | $60,020 |
| 2023 | $2,133 | $88,570 | $31,850 | $56,720 |
| 2022 | $1,975 | $78,457 | $26,600 | $51,857 |
| 2021 | $1,829 | $73,827 | $24,500 | $49,327 |
| 2020 | $1,696 | $72,770 | $23,800 | $48,970 |
| 2019 | $1,589 | $68,282 | $19,950 | $48,332 |
| 2018 | $1,516 | $63,251 | $16,800 | $46,451 |
| 2017 | $1,832 | $62,456 | $15,400 | $47,056 |
| 2016 | $1,420 | $57,961 | $10,850 | $47,111 |
| 2015 | $1,417 | $52,129 | $9,800 | $42,329 |
| 2014 | $1,373 | $45,407 | $7,000 | $38,407 |
T
Landlord's Agent in 2013
Thomas Dimaggio
CAH Realty Nevada LLC
Source: Las Vegas REALTORS®
MLS Number: 1357228
APN: 177-22-515-025
Disclaimer: Certain information contained herein is derived from information provided by parties other than Homes.com. All information provided is deemed reliable, but is not guaranteed to be accurate and should be independently verified.
![]() The data relating to real estate for sale on this web site comes in part from the INTERNET DATA EXCHANGE Program of the Greater Las Vegas Association of REALTORS® MLS. Real estate listings held by brokerage firms other than this site owner are marked with the IDX logo. Information is deemed reliable but not guaranteed. Copyright 2025 of the Greater Las Vegas Association of REALTORS® MLS. All rights reserved.
The data relating to real estate for sale on this web site comes in part from the INTERNET DATA EXCHANGE Program of the Greater Las Vegas Association of REALTORS® MLS. Real estate listings held by brokerage firms other than this site owner are marked with the IDX logo. Information is deemed reliable but not guaranteed. Copyright 2025 of the Greater Las Vegas Association of REALTORS® MLS. All rights reserved.