M
Seller's Agent in 2023
Michael Ablan
HI Pacific Property Management
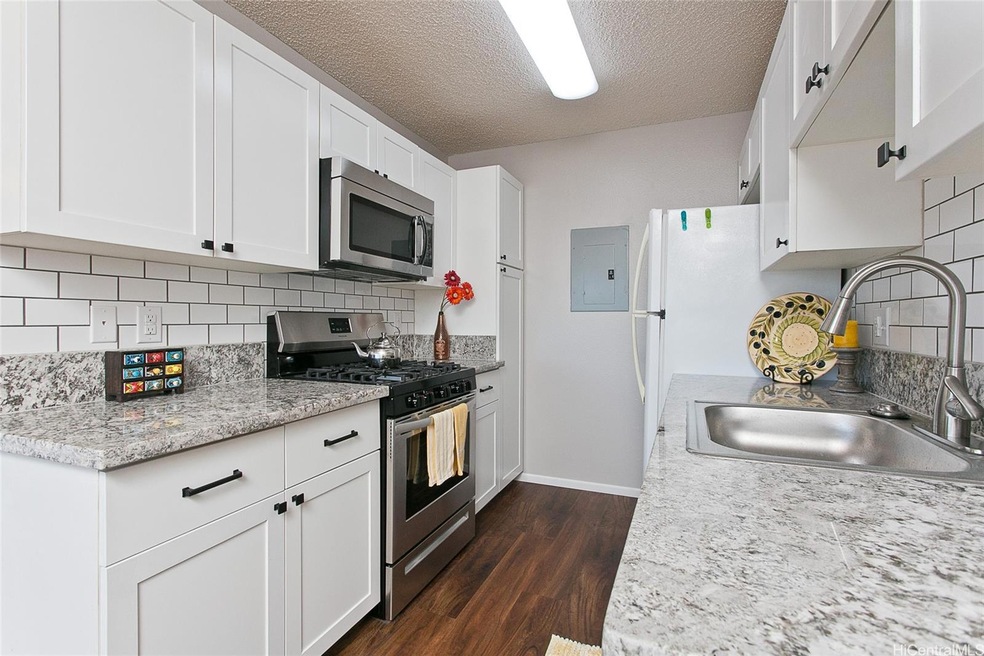
Nicely remodeled upstairs unit. New Flooring: Vinyl plank floors in living room kitchen & bath, carpet in the bedrooms. Freshly painted. Updated kitchen & bath. New Range & Microwave. New tub and tub surround. Water, sewer & gas are separately metered. 2 stalls-1 covered, 1 open. From main driveway, go left to parking structure. Park in stall 390 downstairs or 424 upstairs, take closest stairs to sidewalk and look right, building will be in front of you. Unit is on the opposite corner diagonally, upstairs.
Home Type
Est. Annual Taxes
Year Built
Home Design
Interior Spaces
Kitchen
Flooring
Bedrooms and Bathrooms
Laundry
Parking
Additional Features
Overview
Security
| Date | Type | Sale Price | Title Company |
|---|---|---|---|
| Deed | $379,500 | Or | |
| Warranty Deed | -- | Fam | |
| Warranty Deed | -- | Fam | |
| Limited Warranty Deed | $90,000 | First Financial Title & Escr | |
| Warranty Deed | $168,200 | First Financial Title & Escr |
| Date | Status | Loan Amount | Loan Type |
|---|---|---|---|
| Open | $303,600 | New Conventional | |
| Previous Owner | $365,186 | No Value Available | |
| Previous Owner | $151,850 | No Value Available | |
| Previous Owner | $10,000 | No Value Available | |
| Previous Owner | $116,000 | No Value Available | |
| Previous Owner | $90,000 | VA |
| Date | Event | Price | Change | Sq Ft Price |
|---|---|---|---|---|
| 05/31/2025 05/31/25 | Price Changed | $449,000 | -6.3% | $627 / Sq Ft |
| 05/30/2025 05/30/25 | Price Changed | $479,000 | -2.0% | $669 / Sq Ft |
| 05/06/2025 05/06/25 | Price Changed | $489,000 | -2.0% | $683 / Sq Ft |
| 04/19/2025 04/19/25 | For Sale | $499,000 | 0.0% | $697 / Sq Ft |
| 02/18/2023 02/18/23 | Off Market | $2,300 | -- | -- |
| 02/17/2023 02/17/23 | Rented | $2,300 | 0.0% | -- |
| 01/17/2023 01/17/23 | Price Changed | $2,300 | -4.2% | $3 / Sq Ft |
| 12/27/2022 12/27/22 | Price Changed | $2,400 | -4.0% | $3 / Sq Ft |
| 12/07/2022 12/07/22 | For Rent | $2,500 | 0.0% | -- |
| 09/13/2021 09/13/21 | Sold | $439,000 | 0.0% | $613 / Sq Ft |
| 08/14/2021 08/14/21 | Pending | -- | -- | -- |
| 07/29/2021 07/29/21 | For Sale | $439,000 | +15.7% | $613 / Sq Ft |
| 10/08/2020 10/08/20 | Sold | $379,500 | -4.9% | $530 / Sq Ft |
| 09/08/2020 09/08/20 | Pending | -- | -- | -- |
| 06/09/2020 06/09/20 | For Sale | $399,000 | +10.8% | $557 / Sq Ft |
| 03/23/2020 03/23/20 | Sold | $360,000 | -1.4% | $502 / Sq Ft |
| 02/22/2020 02/22/20 | Pending | -- | -- | -- |
| 01/09/2020 01/09/20 | For Sale | $365,000 | 0.0% | $509 / Sq Ft |
| 10/21/2019 10/21/19 | Rented | $1,900 | -5.0% | -- |
| 09/21/2019 09/21/19 | Under Contract | -- | -- | -- |
| 09/05/2019 09/05/19 | For Rent | $2,000 | 0.0% | -- |
| 09/14/2018 09/14/18 | Sold | $357,500 | 0.0% | $499 / Sq Ft |
| 08/15/2018 08/15/18 | Pending | -- | -- | -- |
| 07/23/2018 07/23/18 | For Sale | $357,500 | 0.0% | $499 / Sq Ft |
| 09/11/2017 09/11/17 | Rented | $2,000 | 0.0% | -- |
| 09/11/2017 09/11/17 | For Rent | $2,000 | 0.0% | -- |
| 06/07/2016 06/07/16 | Rented | $2,000 | 0.0% | -- |
| 05/08/2016 05/08/16 | Under Contract | -- | -- | -- |
| 01/06/2016 01/06/16 | For Rent | $2,000 | 0.0% | -- |
| 04/29/2015 04/29/15 | Sold | $275,000 | -1.1% | $384 / Sq Ft |
| 04/07/2015 04/07/15 | Sold | $278,000 | -0.4% | $388 / Sq Ft |
| 03/30/2015 03/30/15 | Pending | -- | -- | -- |
| 03/26/2015 03/26/15 | For Sale | $279,000 | +35.3% | $389 / Sq Ft |
| 03/08/2015 03/08/15 | Pending | -- | -- | -- |
| 01/23/2015 01/23/15 | Sold | $206,164 | -24.8% | $289 / Sq Ft |
| 01/07/2015 01/07/15 | For Sale | $274,000 | +2.2% | $382 / Sq Ft |
| 12/24/2014 12/24/14 | Pending | -- | -- | -- |
| 11/14/2014 11/14/14 | Sold | $268,000 | -0.7% | $374 / Sq Ft |
| 10/15/2014 10/15/14 | Pending | -- | -- | -- |
| 08/21/2014 08/21/14 | For Sale | $270,000 | +14.9% | $377 / Sq Ft |
| 07/30/2014 07/30/14 | For Sale | $235,000 | -- | $329 / Sq Ft |
| Year | Tax Paid | Tax Assessment Tax Assessment Total Assessment is a certain percentage of the fair market value that is determined by local assessors to be the total taxable value of land and additions on the property. | Land | Improvement |
|---|---|---|---|---|
| 2025 | $1,682 | $489,400 | $170,400 | $319,000 |
| 2024 | $1,682 | $480,700 | $163,900 | $316,800 |
| 2023 | $1,722 | $492,100 | $163,900 | $328,200 |
| 2022 | $1,499 | $428,300 | $157,300 | $271,000 |
| 2021 | $949 | $371,200 | $157,300 | $213,900 |
| 2020 | $908 | $359,300 | $157,300 | $202,000 |
| 2019 | $891 | $361,900 | $144,200 | $217,700 |
| 2018 | $891 | $334,700 | $118,000 | $216,700 |
| 2017 | $727 | $287,600 | $89,100 | $198,500 |
| 2016 | $628 | $259,300 | $83,900 | $175,400 |
| 2015 | $633 | $260,900 | $81,300 | $179,600 |
| 2014 | $416 | $230,200 | $99,800 | $130,400 |
M
Seller's Agent in 2023
Michael Ablan
HI Pacific Property Management
D
Seller Co-Listing Agent in 2023
Duke Kimhan
HI Pacific Property Management

Seller's Agent in 2021
Bernie Tong
Locations LLC
(808) 306-0430
3 in this area
87 Total Sales
R
Buyer's Agent in 2021
Roland Filipiak
Keller Williams Honolulu
(808) 228-8065
26 in this area
70 Total Sales
K
Seller's Agent in 2020
Katherine Kelii
West Beach Realty, Inc.
(808) 696-4774
4 in this area
87 Total Sales
J
Seller's Agent in 2020
Joan Graham
Coldwell Banker Realty
(808) 262-3104
8 in this area
49 Total Sales
Source: HiCentral MLS (Honolulu Board of REALTORS®)
MLS Number: 202119669
APN: 1-9-1-061-025-0004
Disclaimer: Certain information contained herein is derived from information provided by parties other than Homes.com. All information provided is deemed reliable, but is not guaranteed to be accurate and should be independently verified.
![]() Some of the active listings appearing on this site may be listed by other REALTORS(R). If you are interested in those active listings, our company may represent you as the buyer's agent. If the active listing you are interested in is our company's active listing, you may speak to one of our agents regarding your options for representation.
Some of the active listings appearing on this site may be listed by other REALTORS(R). If you are interested in those active listings, our company may represent you as the buyer's agent. If the active listing you are interested in is our company's active listing, you may speak to one of our agents regarding your options for representation.
Based on information from the Multiple Listing Service of HiCentral MLS, Ltd. Information is deemed reliable but not guaranteed. Copyright 2025 HiCentral MLS, Ltd