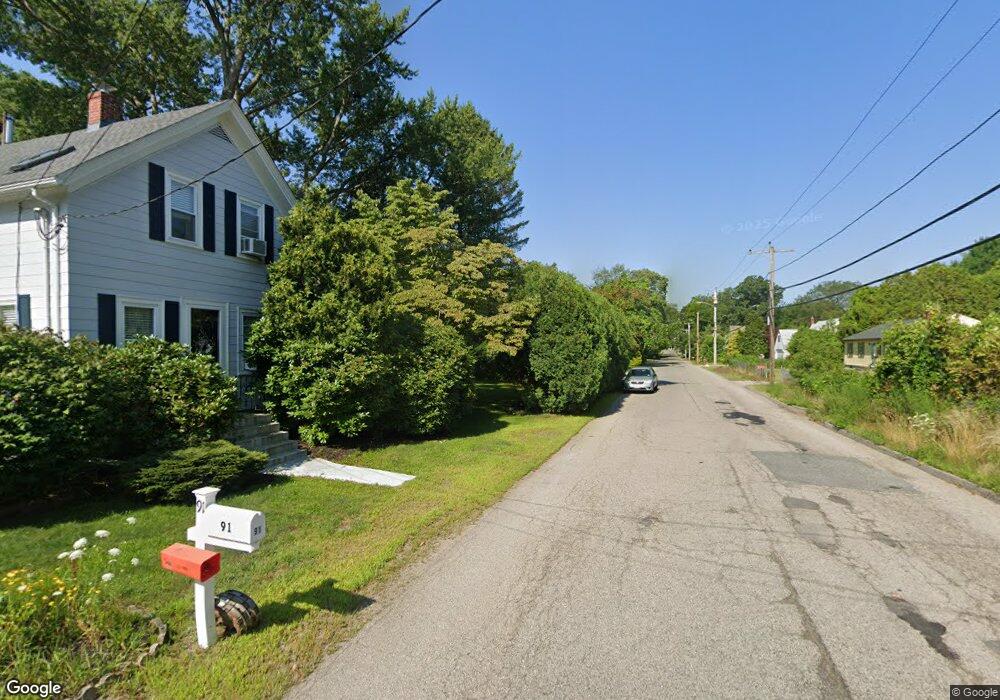
91 Dexter St Attleboro, MA 02703
Estimated Value: $406,265 - $456,000
2
Beds
1
Bath
984
Sq Ft
$443/Sq Ft
Est. Value
About This Home
This home is located at 91 Dexter St, Attleboro, MA 02703 and is currently estimated at $436,066, approximately $443 per square foot. 91 Dexter St is a home located in Bristol County with nearby schools including Peter Thacher Elementary School, Wamsutta Middle School, and Attleboro High School.
Ownership History
Date
Name
Owned For
Owner Type
Purchase Details
Closed on
Jun 2, 2009
Sold by
Dulude Jeffrey W
Bought by
Dulude Jeffrey W and Dulude Mary E
Current Estimated Value
Purchase Details
Closed on
Sep 7, 1994
Sold by
Laizza John A and Dodson Matilda
Bought by
Dulude Jeffrey W and Gogan Elizabeth A
Purchase Details
Closed on
Apr 24, 1990
Sold by
Desrosiers Geo R
Bought by
Laizza John A
Create a Home Valuation Report for This Property
The Home Valuation Report is an in-depth analysis detailing your home's value as well as a comparison with similar homes in the area
Home Values in the Area
Average Home Value in this Area
Purchase History
| Date | Buyer | Sale Price | Title Company |
|---|---|---|---|
| Dulude Jeffrey W | -- | -- | |
| Dulude Jeffrey W | $90,000 | -- | |
| Laizza John A | $119,900 | -- |
Source: Public Records
Mortgage History
| Date | Status | Borrower | Loan Amount |
|---|---|---|---|
| Previous Owner | Laizza John A | $134,400 | |
| Previous Owner | Laizza John A | $10,000 |
Source: Public Records
Tax History
| Year | Tax Paid | Tax Assessment Tax Assessment Total Assessment is a certain percentage of the fair market value that is determined by local assessors to be the total taxable value of land and additions on the property. | Land | Improvement |
|---|---|---|---|---|
| 2025 | $4,327 | $344,800 | $141,600 | $203,200 |
| 2024 | $4,338 | $340,800 | $141,600 | $199,200 |
| 2023 | $4,185 | $305,700 | $128,900 | $176,800 |
| 2022 | $4,071 | $281,700 | $122,600 | $159,100 |
| 2021 | $3,727 | $251,800 | $118,000 | $133,800 |
| 2020 | $3,647 | $250,500 | $114,800 | $135,700 |
| 2019 | $3,407 | $240,600 | $112,600 | $128,000 |
| 2018 | $4,663 | $219,300 | $109,200 | $110,100 |
| 2017 | $3,211 | $220,700 | $109,200 | $111,500 |
| 2016 | $3,025 | $204,100 | $107,300 | $96,800 |
| 2015 | $2,793 | $189,900 | $107,300 | $82,600 |
| 2014 | $2,712 | $182,600 | $102,100 | $80,500 |
Source: Public Records
Map
Nearby Homes
- 95 Mulberry St
- 43 Maple St
- 0 Alvin St (Lot 501)
- 91 East St
- 138 Fisher St Unit A
- 138 Fisher St Unit B
- 17 Capron St
- 61 Pine St Unit 9
- 19 Beech St
- 231 Park St
- 28 Pine St Unit C
- 147 County St
- 17 Crawford Ave
- 0 Joseph St Unit 73469304
- 0 Tulip Unit 73475130
- 45 Holman St
- 49 Dennis St
- 37 Holman St
- 21 4th St
- 18-20 Jefferson St
Your Personal Tour Guide
Ask me questions while you tour the home.