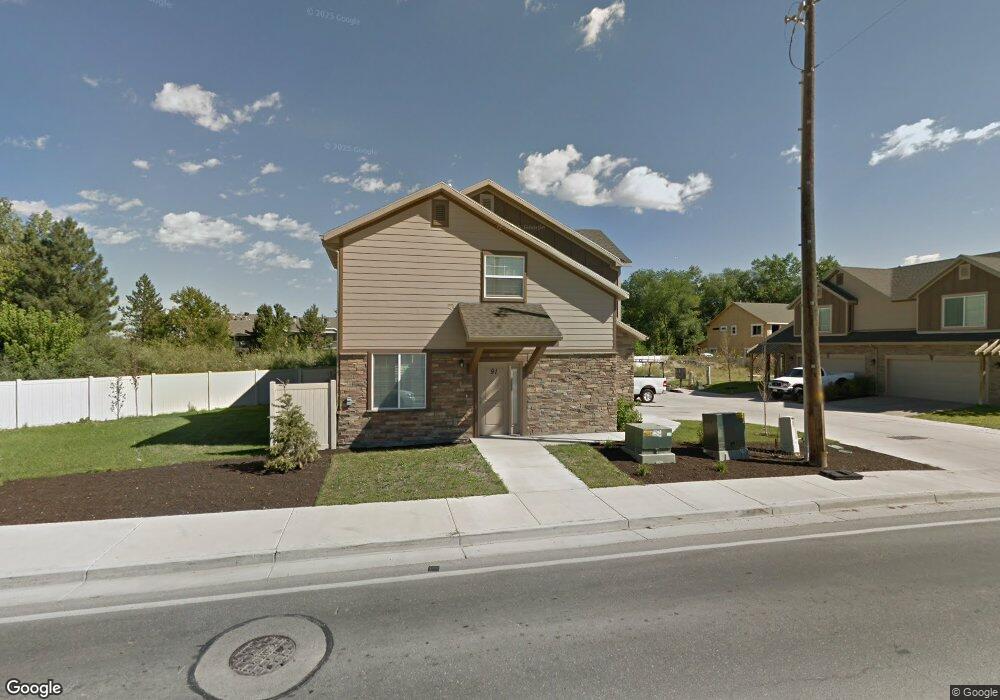
91 E 8000 S Midvale, UT 84047
Estimated Value: $402,000 - $508,000
6
Beds
4
Baths
2,800
Sq Ft
$158/Sq Ft
Est. Value
About This Home
This home is located at 91 E 8000 S, Midvale, UT 84047 and is currently estimated at $443,382, approximately $158 per square foot. 91 E 8000 S is a home located in Salt Lake County with nearby schools including Midvalley Elementary School, Union Middle School, and Hillcrest High School.
Ownership History
Date
Name
Owned For
Owner Type
Purchase Details
Closed on
Jul 29, 2025
Sold by
Mahony Michael and Sit Erica Wing
Bought by
Perry Alek and Fox Jericha
Current Estimated Value
Home Financials for this Owner
Home Financials are based on the most recent Mortgage that was taken out on this home.
Original Mortgage
$376,020
Outstanding Balance
$375,700
Interest Rate
6.81%
Mortgage Type
New Conventional
Estimated Equity
$67,682
Purchase Details
Closed on
May 4, 2023
Sold by
Mahony Michael
Bought by
Mahony Michael and Sit Erica Wing
Home Financials for this Owner
Home Financials are based on the most recent Mortgage that was taken out on this home.
Original Mortgage
$413,000
Interest Rate
6.42%
Mortgage Type
New Conventional
Purchase Details
Closed on
Mar 31, 2020
Sold by
Jensen George R
Bought by
Fuelling Daniel
Home Financials for this Owner
Home Financials are based on the most recent Mortgage that was taken out on this home.
Original Mortgage
$275,500
Interest Rate
3.2%
Mortgage Type
New Conventional
Purchase Details
Closed on
Dec 15, 2017
Sold by
Creckside Townhomes Llc
Bought by
Jensen George R
Home Financials for this Owner
Home Financials are based on the most recent Mortgage that was taken out on this home.
Original Mortgage
$175,010
Interest Rate
3.94%
Mortgage Type
FHA
Create a Home Valuation Report for This Property
The Home Valuation Report is an in-depth analysis detailing your home's value as well as a comparison with similar homes in the area
Home Values in the Area
Average Home Value in this Area
Purchase History
| Date | Buyer | Sale Price | Title Company |
|---|---|---|---|
| Perry Alek | -- | First American Title Insurance | |
| Perry Alek | -- | First American Title Insurance | |
| Mahony Michael | -- | -- | |
| Mahony Michael | -- | Masters Title | |
| Fuelling Daniel | -- | Title Guarantee | |
| Jensen George R | -- | Unity Title Llc |
Source: Public Records
Mortgage History
| Date | Status | Borrower | Loan Amount |
|---|---|---|---|
| Open | Perry Alek | $376,020 | |
| Closed | Perry Alek | $376,020 | |
| Previous Owner | Mahony Michael | $413,000 | |
| Previous Owner | Fuelling Daniel | $275,500 | |
| Previous Owner | Jensen George R | $175,010 |
Source: Public Records
Tax History
| Year | Tax Paid | Tax Assessment Tax Assessment Total Assessment is a certain percentage of the fair market value that is determined by local assessors to be the total taxable value of land and additions on the property. | Land | Improvement |
|---|---|---|---|---|
| 2025 | $2,578 | $434,300 | $53,800 | $380,500 |
| 2024 | $2,578 | $423,300 | $50,600 | $372,700 |
| 2023 | $2,329 | $378,900 | $48,100 | $330,800 |
| 2022 | $2,436 | $387,200 | $47,200 | $340,000 |
| 2021 | $2,174 | $295,400 | $41,000 | $254,400 |
| 2020 | $2,017 | $259,300 | $33,200 | $226,100 |
| 2019 | $1,928 | $241,500 | $31,500 | $210,000 |
| 2018 | $1,892 | $239,700 | $31,500 | $208,200 |
| 2017 | $1,857 | $226,100 | $29,500 | $196,600 |
| 2016 | $1,818 | $214,700 | $44,600 | $170,100 |
| 2015 | $1,900 | $220,500 | $46,400 | $174,100 |
| 2014 | $1,916 | $217,200 | $45,100 | $172,100 |
Source: Public Records
Map
Nearby Homes
- 135 E Station St
- 190 E White Spruce Cove Unit 805
- 257 E Water Mill Way
- 257 Water Mill Way Unit 211
- 8229 S Resaca Dr Unit D9
- 90 E Resaca Dr Unit C11
- 274 E Water Mill Way Unit 230
- 74 E Resaca Dr Unit B12
- 7824 S 280 E
- 7914 S Harvel Dr
- 8257 S 180 E
- 8278 S Resaca Dr Unit L-10
- 8278 S Resaca Dr Unit L1
- 136 E Chambord Ct
- 138 E Chambord Ct
- 140 E Chambord Ct
- 144 E Chambord Ct
- 132 E Chambord Ct
- 379 E Horse Creek Dr
- 36 Marquette Dr
Your Personal Tour Guide
Ask me questions while you tour the home.