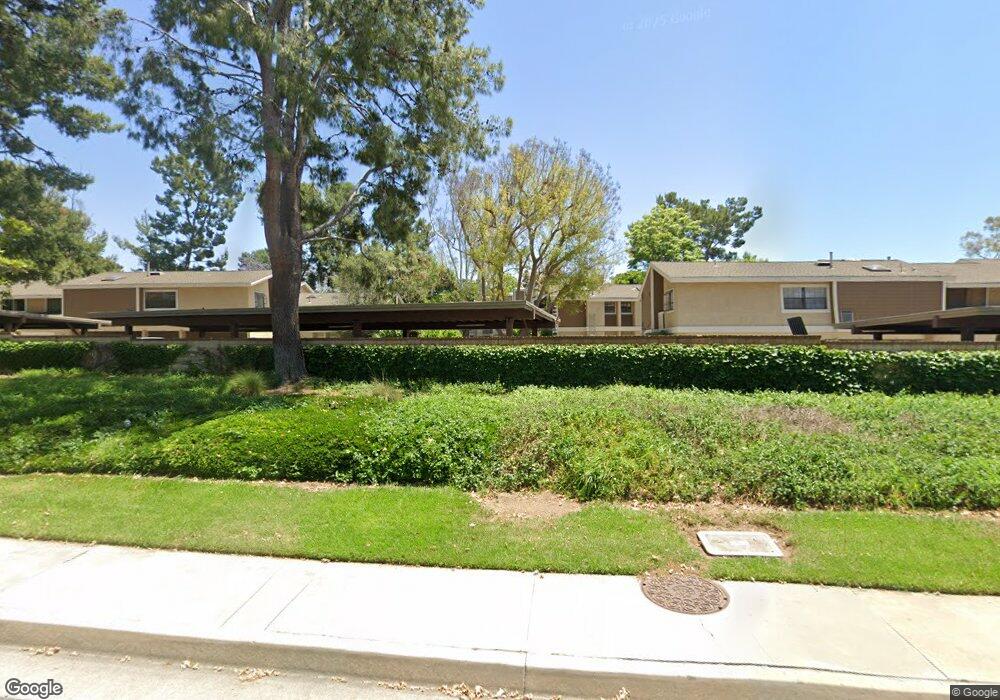
91 Lakepines Unit 835A Irvine, CA 92620
Northwood NeighborhoodEstimated Value: $516,000 - $1,481,127
1
Bed
1
Bath
681
Sq Ft
$1,157/Sq Ft
Est. Value
About This Home
This home is located at 91 Lakepines Unit 835A, Irvine, CA 92620 and is currently estimated at $787,782, approximately $1,156 per square foot. 91 Lakepines Unit 835A is a home located in Orange County with nearby schools including Santiago Hills Elementary School, Sierra Vista Middle School, and Northwood High School.
Ownership History
Date
Name
Owned For
Owner Type
Purchase Details
Closed on
Sep 13, 2016
Sold by
Pena Paula
Bought by
Mohajar Pantea
Current Estimated Value
Home Financials for this Owner
Home Financials are based on the most recent Mortgage that was taken out on this home.
Original Mortgage
$250,800
Interest Rate
3.47%
Mortgage Type
New Conventional
Purchase Details
Closed on
Jun 13, 2016
Sold by
Ceballos Miguel
Bought by
Pena Paula
Purchase Details
Closed on
May 31, 2016
Sold by
Evett Edward Gene
Bought by
Ceballos Miguel
Purchase Details
Closed on
Dec 7, 2012
Sold by
Helgeson Linda A
Bought by
Haase James and Haase Patricia
Purchase Details
Closed on
Aug 11, 1993
Sold by
Engle Diane
Bought by
Evett Marlon
Home Financials for this Owner
Home Financials are based on the most recent Mortgage that was taken out on this home.
Original Mortgage
$108,047
Interest Rate
6.95%
Mortgage Type
VA
Create a Home Valuation Report for This Property
The Home Valuation Report is an in-depth analysis detailing your home's value as well as a comparison with similar homes in the area
Home Values in the Area
Average Home Value in this Area
Purchase History
| Date | Buyer | Sale Price | Title Company |
|---|---|---|---|
| Mohajar Pantea | $264,000 | Fidelity National Title | |
| Pena Paula | $76,200 | None Available | |
| Ceballos Miguel | $76,500 | Fidelity National Title | |
| Haase James | $745,000 | Lawyers Title | |
| Evett Marlon | $105,000 | Orange Coast Title Company |
Source: Public Records
Mortgage History
| Date | Status | Borrower | Loan Amount |
|---|---|---|---|
| Previous Owner | Mohajar Pantea | $250,800 | |
| Previous Owner | Evett Marlon | $108,047 |
Source: Public Records
Tax History Compared to Growth
Tax History
| Year | Tax Paid | Tax Assessment Tax Assessment Total Assessment is a certain percentage of the fair market value that is determined by local assessors to be the total taxable value of land and additions on the property. | Land | Improvement |
|---|---|---|---|---|
| 2025 | $3,297 | $306,391 | $245,708 | $60,683 |
| 2024 | $3,297 | $300,384 | $240,890 | $59,494 |
| 2023 | $3,212 | $294,495 | $236,167 | $58,328 |
| 2022 | $3,145 | $288,721 | $231,536 | $57,185 |
| 2021 | $3,071 | $283,060 | $226,996 | $56,064 |
| 2020 | $3,054 | $280,158 | $224,668 | $55,490 |
| 2019 | $2,987 | $274,665 | $220,263 | $54,402 |
| 2018 | $2,933 | $269,280 | $215,944 | $53,336 |
| 2017 | $2,872 | $264,000 | $211,709 | $52,291 |
| 2016 | $1,592 | $150,607 | $82,784 | $67,823 |
| 2015 | $1,515 | $148,345 | $81,540 | $66,805 |
| 2014 | $1,485 | $145,440 | $79,943 | $65,497 |
Source: Public Records
Map
Nearby Homes