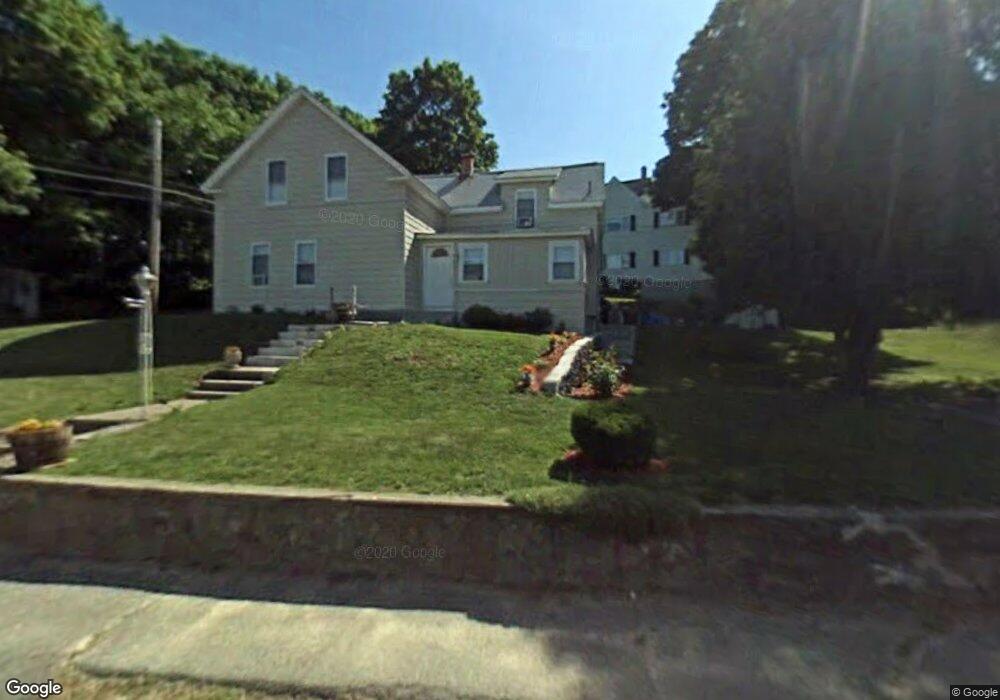
91 Manning St Hudson, MA 01749
Estimated Value: $503,000 - $690,000
3
Beds
2
Baths
1,625
Sq Ft
$350/Sq Ft
Est. Value
About This Home
This home is located at 91 Manning St, Hudson, MA 01749 and is currently estimated at $569,304, approximately $350 per square foot. 91 Manning St is a home located in Middlesex County with nearby schools including David J. Quinn Middle School, Hudson High School, and First Steps Children's Center.
Ownership History
Date
Name
Owned For
Owner Type
Purchase Details
Closed on
Oct 31, 2007
Sold by
Silva Mariano and Silva Nelia M
Bought by
91 Manning Street Rt and Silva
Current Estimated Value
Purchase Details
Closed on
Dec 23, 1994
Sold by
Uribe Enrique and Uribe Iberia
Bought by
Sousa Gualdino M and Sousa Nelia M
Home Financials for this Owner
Home Financials are based on the most recent Mortgage that was taken out on this home.
Original Mortgage
$82,500
Interest Rate
9.19%
Mortgage Type
Purchase Money Mortgage
Create a Home Valuation Report for This Property
The Home Valuation Report is an in-depth analysis detailing your home's value as well as a comparison with similar homes in the area
Home Values in the Area
Average Home Value in this Area
Purchase History
We collect this data history from publicly available records. To have your information removed, we recommend requesting removal directly through your county’s website.
| Date | Buyer | Sale Price | Title Company |
|---|---|---|---|
| 91 Manning Street Rt | -- | -- | |
| 91 Manning Street Rt | -- | -- | |
| Sousa Gualdino M | $93,000 | -- |
Source: Public Records
Mortgage History
We collect this data history from publicly available records. To have your information removed, we recommend requesting removal directly through your county’s website.
| Date | Status | Borrower | Loan Amount |
|---|---|---|---|
| Previous Owner | Sousa Gualdino M | $101,000 | |
| Previous Owner | Sousa Gualdino M | $20,000 | |
| Previous Owner | Sousa Gualdino M | $82,500 |
Source: Public Records
Tax History
| Year | Tax Paid | Tax Assessment Tax Assessment Total Assessment is a certain percentage of the fair market value that is determined by local assessors to be the total taxable value of land and additions on the property. | Land | Improvement |
|---|---|---|---|---|
| 2025 | $6,085 | $438,400 | $166,800 | $271,600 |
| 2024 | $5,746 | $410,400 | $151,600 | $258,800 |
| 2023 | $5,583 | $382,400 | $145,800 | $236,600 |
| 2022 | $5,129 | $323,400 | $132,500 | $190,900 |
| 2021 | $5,007 | $301,800 | $126,200 | $175,600 |
| 2020 | $5,785 | $281,600 | $123,700 | $157,900 |
| 2019 | $5,709 | $280,400 | $123,700 | $156,700 |
| 2018 | $4,473 | $255,600 | $117,800 | $137,800 |
| 2017 | $5,349 | $237,000 | $112,200 | $124,800 |
| 2016 | $4,016 | $232,300 | $112,200 | $120,100 |
| 2015 | $3,874 | $224,300 | $112,200 | $112,100 |
| 2014 | $3,676 | $211,000 | $98,300 | $112,700 |
Source: Public Records
Map
Nearby Homes
- 52 High St
- 250 Main St Unit 204
- 107 Apsley St
- 38 Cherry St Unit B
- 200 Manning St Unit 23C
- 200 Manning St Unit 19C
- 200 Manning St Unit 6B
- 28 Vinal St
- 18 O'Neil St
- 30 Vinal St
- 29 Grove St Unit B
- 251 Cox St
- 17 School St Unit A
- 17 School St Unit C
- 48 Forest Ave
- 5 Plant Ave
- 6 Edith Rd
- 39-41 Green St
- 17 Mason St
- 2 Alan Rd
Your Personal Tour Guide
Ask me questions while you tour the home.