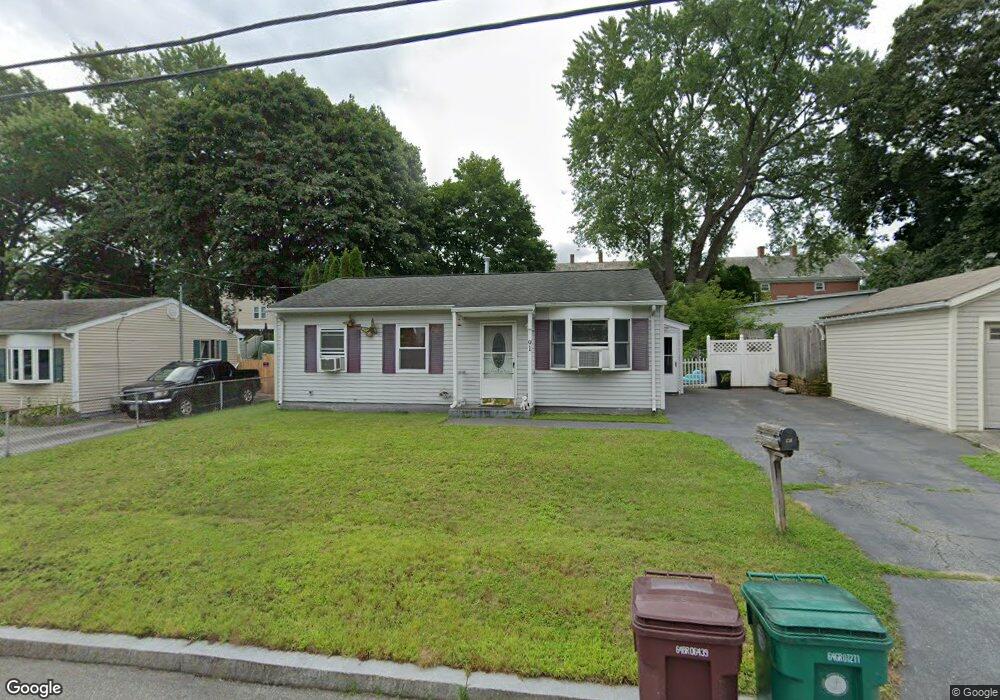
91 Rivulet St Woonsocket, RI 02895
North End NeighborhoodEstimated Value: $322,000 - $343,000
3
Beds
1
Bath
864
Sq Ft
$383/Sq Ft
Est. Value
About This Home
This home is located at 91 Rivulet St, Woonsocket, RI 02895 and is currently estimated at $331,021, approximately $383 per square foot. 91 Rivulet St is a home located in Providence County with nearby schools including Woonsocket High School, Rise Prep Mayoral Academy Middle School, and Rise Prep Mayoral Academy.
Ownership History
Date
Name
Owned For
Owner Type
Purchase Details
Closed on
Oct 21, 2013
Sold by
Lanoue Anna B
Bought by
Lanoue Anna B and Lanoue Mark L
Current Estimated Value
Purchase Details
Closed on
May 18, 1998
Sold by
Noiseux Rita
Bought by
Manoue George R and Lanoue Anna
Purchase Details
Closed on
Dec 29, 1993
Sold by
Laurie Kim Butler
Bought by
Butler Robert T
Create a Home Valuation Report for This Property
The Home Valuation Report is an in-depth analysis detailing your home's value as well as a comparison with similar homes in the area
Home Values in the Area
Average Home Value in this Area
Purchase History
| Date | Buyer | Sale Price | Title Company |
|---|---|---|---|
| Lanoue Anna B | -- | -- | |
| Manoue George R | $75,000 | -- | |
| Butler Robert T | $57,500 | -- | |
| Lanoue Anna B | -- | -- | |
| Manoue George R | $75,000 | -- | |
| Butler Robert T | $57,500 | -- |
Source: Public Records
Mortgage History
| Date | Status | Borrower | Loan Amount |
|---|---|---|---|
| Previous Owner | Butler Robert T | $130,000 | |
| Previous Owner | Butler Robert T | $106,000 | |
| Previous Owner | Butler Robert T | $93,000 |
Source: Public Records
Tax History Compared to Growth
Tax History
| Year | Tax Paid | Tax Assessment Tax Assessment Total Assessment is a certain percentage of the fair market value that is determined by local assessors to be the total taxable value of land and additions on the property. | Land | Improvement |
|---|---|---|---|---|
| 2025 | $3,449 | $307,100 | $106,900 | $200,200 |
| 2024 | $3,199 | $220,000 | $94,800 | $125,200 |
| 2023 | $3,076 | $220,000 | $94,800 | $125,200 |
| 2022 | $3,076 | $220,000 | $94,800 | $125,200 |
| 2021 | $3,118 | $131,300 | $59,700 | $71,600 |
| 2020 | $3,151 | $131,300 | $59,700 | $71,600 |
| 2018 | $3,162 | $131,300 | $59,700 | $71,600 |
| 2017 | $3,299 | $109,600 | $46,600 | $63,000 |
| 2016 | $3,490 | $109,600 | $46,600 | $63,000 |
| 2015 | $4,009 | $109,600 | $46,600 | $63,000 |
| 2014 | $4,216 | $117,300 | $51,300 | $66,000 |
Source: Public Records
Map
Nearby Homes