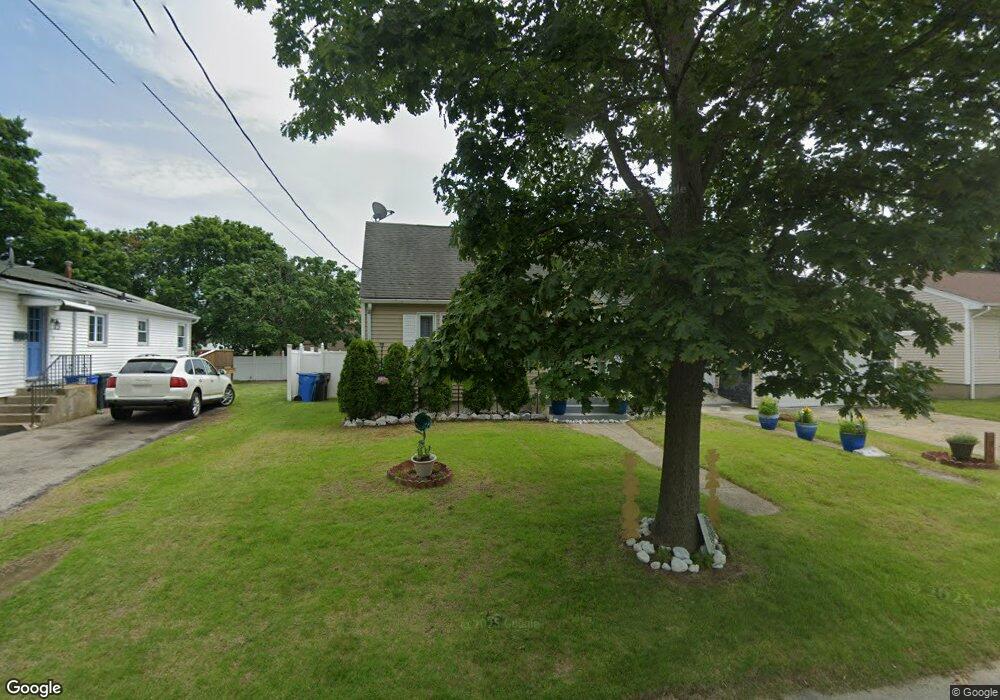
91 Sharon St Cranston, RI 02910
Park View NeighborhoodEstimated Value: $381,000 - $399,000
3
Beds
1
Bath
1,652
Sq Ft
$237/Sq Ft
Est. Value
About This Home
This home is located at 91 Sharon St, Cranston, RI 02910 and is currently estimated at $391,347, approximately $236 per square foot. 91 Sharon St is a home located in Providence County with nearby schools including Edgewood Highland Elementary School, Edward S. Rhodes School, and Park View Middle School.
Ownership History
Date
Name
Owned For
Owner Type
Purchase Details
Closed on
Jul 7, 2008
Sold by
Bellavance Jay J and Aftosmes Patty C
Bought by
Diaz Nuris and Parra Jimmy
Current Estimated Value
Home Financials for this Owner
Home Financials are based on the most recent Mortgage that was taken out on this home.
Original Mortgage
$173,430
Interest Rate
6.01%
Mortgage Type
Purchase Money Mortgage
Purchase Details
Closed on
Jan 19, 2006
Sold by
Wheeler Peter E
Bought by
Bellavance Jay and Aftosmes Patty C
Home Financials for this Owner
Home Financials are based on the most recent Mortgage that was taken out on this home.
Original Mortgage
$208,328
Interest Rate
6.33%
Mortgage Type
Purchase Money Mortgage
Purchase Details
Closed on
Nov 21, 2000
Sold by
Sousa Richard
Bought by
Wheeler Peter E
Purchase Details
Closed on
Sep 28, 1995
Sold by
Dorgan Linda S
Bought by
Sousa Richard
Create a Home Valuation Report for This Property
The Home Valuation Report is an in-depth analysis detailing your home's value as well as a comparison with similar homes in the area
Home Values in the Area
Average Home Value in this Area
Purchase History
| Date | Buyer | Sale Price | Title Company |
|---|---|---|---|
| Diaz Nuris | $175,000 | -- | |
| Bellavance Jay | $21,000 | -- | |
| Wheeler Peter E | $95,000 | -- | |
| Sousa Richard | $84,000 | -- |
Source: Public Records
Mortgage History
| Date | Status | Borrower | Loan Amount |
|---|---|---|---|
| Open | Sousa Richard | $160,725 | |
| Closed | Sousa Richard | $172,550 | |
| Closed | Sousa Richard | $173,430 | |
| Previous Owner | Sousa Richard | $208,328 |
Source: Public Records
Tax History Compared to Growth
Tax History
| Year | Tax Paid | Tax Assessment Tax Assessment Total Assessment is a certain percentage of the fair market value that is determined by local assessors to be the total taxable value of land and additions on the property. | Land | Improvement |
|---|---|---|---|---|
| 2025 | $4,564 | $328,800 | $100,600 | $228,200 |
| 2024 | $4,400 | $323,300 | $100,600 | $222,700 |
| 2023 | $4,222 | $223,400 | $69,400 | $154,000 |
| 2022 | $4,135 | $223,400 | $69,400 | $154,000 |
| 2021 | $4,021 | $223,400 | $69,400 | $154,000 |
| 2020 | $3,797 | $182,800 | $65,900 | $116,900 |
| 2019 | $3,797 | $182,800 | $65,900 | $116,900 |
| 2018 | $3,709 | $182,800 | $65,900 | $116,900 |
| 2017 | $3,489 | $152,100 | $48,500 | $103,600 |
| 2016 | $3,415 | $152,100 | $48,500 | $103,600 |
| 2015 | $3,415 | $152,100 | $48,500 | $103,600 |
| 2014 | $3,195 | $139,900 | $48,500 | $91,400 |
Source: Public Records
Map
Nearby Homes