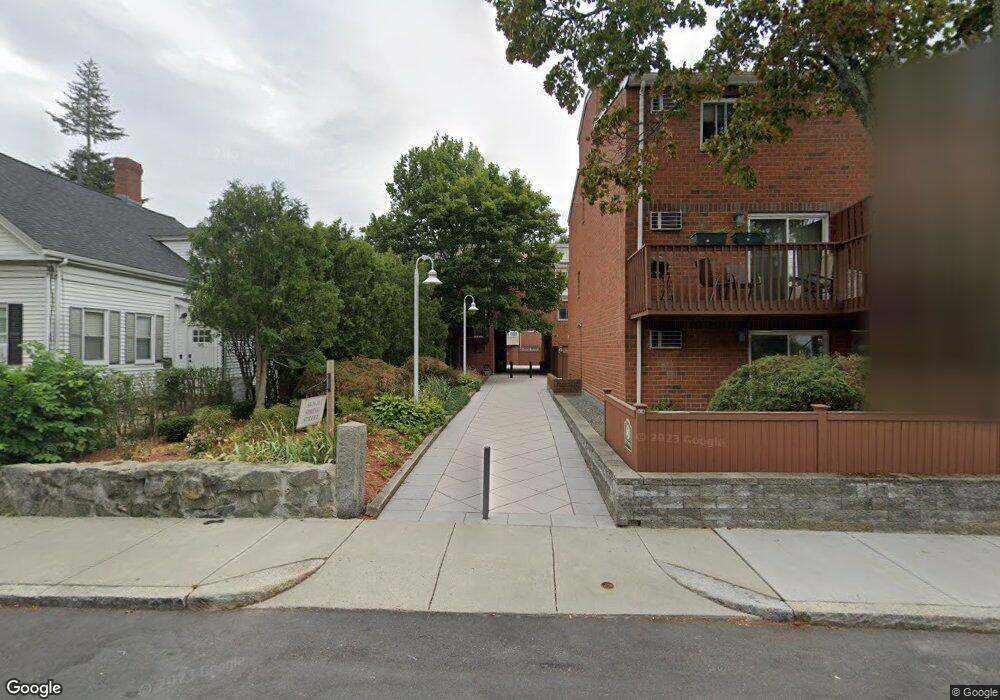
91 Spring St Unit 8 Watertown, MA 02472
West Watertown NeighborhoodEstimated Value: $596,644 - $776,000
2
Beds
2
Baths
1,190
Sq Ft
$583/Sq Ft
Est. Value
About This Home
This home is located at 91 Spring St Unit 8, Watertown, MA 02472 and is currently estimated at $693,661, approximately $582 per square foot. 91 Spring St Unit 8 is a home located in Middlesex County with nearby schools including The Kendall School and Beacon High School.
Ownership History
Date
Name
Owned For
Owner Type
Purchase Details
Closed on
Mar 26, 2003
Sold by
Omar Sulieyman
Bought by
Zorrilla-Ramirez Claudia and Arce Emilio
Current Estimated Value
Home Financials for this Owner
Home Financials are based on the most recent Mortgage that was taken out on this home.
Original Mortgage
$289,750
Interest Rate
5.91%
Mortgage Type
Purchase Money Mortgage
Purchase Details
Closed on
Sep 1, 1998
Sold by
Tarnow Stephen J and Tarnow Diane E
Bought by
Omar Sulieyman
Home Financials for this Owner
Home Financials are based on the most recent Mortgage that was taken out on this home.
Original Mortgage
$154,900
Interest Rate
6.9%
Mortgage Type
Purchase Money Mortgage
Purchase Details
Closed on
Apr 4, 1989
Sold by
Danesi Gioia L
Bought by
Tarnow Stephen J
Home Financials for this Owner
Home Financials are based on the most recent Mortgage that was taken out on this home.
Original Mortgage
$149,500
Interest Rate
10.63%
Mortgage Type
Purchase Money Mortgage
Create a Home Valuation Report for This Property
The Home Valuation Report is an in-depth analysis detailing your home's value as well as a comparison with similar homes in the area
Home Values in the Area
Average Home Value in this Area
Purchase History
| Date | Buyer | Sale Price | Title Company |
|---|---|---|---|
| Zorrilla-Ramirez Claudia | $305,000 | -- | |
| Omar Sulieyman | $172,166 | -- | |
| Tarnow Stephen J | $168,000 | -- |
Source: Public Records
Mortgage History
| Date | Status | Borrower | Loan Amount |
|---|---|---|---|
| Open | Tarnow Stephen J | $260,000 | |
| Closed | Zorrilla-Ramirez Claudia | $289,750 | |
| Previous Owner | Tarnow Stephen J | $154,900 | |
| Previous Owner | Tarnow Stephen J | $110,500 | |
| Previous Owner | Tarnow Stephen J | $149,500 |
Source: Public Records
Tax History Compared to Growth
Tax History
| Year | Tax Paid | Tax Assessment Tax Assessment Total Assessment is a certain percentage of the fair market value that is determined by local assessors to be the total taxable value of land and additions on the property. | Land | Improvement |
|---|---|---|---|---|
| 2025 | $5,856 | $501,400 | $0 | $501,400 |
| 2024 | $5,731 | $489,800 | $0 | $489,800 |
| 2023 | $6,544 | $481,900 | $0 | $481,900 |
| 2022 | $5,943 | $448,500 | $0 | $448,500 |
| 2021 | $5,452 | $445,100 | $0 | $445,100 |
| 2020 | $5,610 | $462,100 | $0 | $462,100 |
| 2019 | $5,250 | $407,600 | $0 | $407,600 |
| 2018 | $5,036 | $373,900 | $0 | $373,900 |
| 2017 | $4,735 | $340,900 | $0 | $340,900 |
| 2016 | $4,103 | $299,900 | $0 | $299,900 |
| 2015 | $4,133 | $275,000 | $0 | $275,000 |
| 2014 | $3,890 | $260,000 | $0 | $260,000 |
Source: Public Records
Map
Nearby Homes
- 21 Fayette St Unit 1
- 61-63 Church St
- 93 Spring St Unit 29
- 71 Palfrey St Unit 71
- 91 Fayette St
- 126 Summer St Unit 126
- 11 Broadway Unit 11
- 14 N Beacon Ct
- 25 Ladd St Unit 25
- 25 Ladd St
- 27 Ladd St Unit 27
- 214 Palfrey St
- 12 Cuba St Unit 12
- 99 Pleasant St Unit 2-1
- 14 Royal St
- 235 Mount Auburn St
- 77 Forest St
- 5 Chatham Way Unit 5
- 64 California St Unit 64
- 77 Waverley Ave Unit 77
- 91 Spring St Unit F
- 91 Spring St Unit 18
- 91 Spring St Unit 14
- 91 Spring St Unit 9
- 91 Spring St Unit 21
- 91 Spring St Unit 20
- 91 Spring St Unit 19
- 91 Spring St Unit 17
- 91 Spring St Unit 16
- 91 Spring St Unit 15
- 91 Spring St Unit 13
- 91 Spring St Unit 12
- 91 Spring St Unit 11
- 91 Spring St Unit 10
- 91 Spring St Unit 7
- 91 Spring St Unit A
- 91C Spring St Unit 16
- 91 Spring St Unit x
- 91 Spring St Unit B
- 91 Spring St Unit 8b