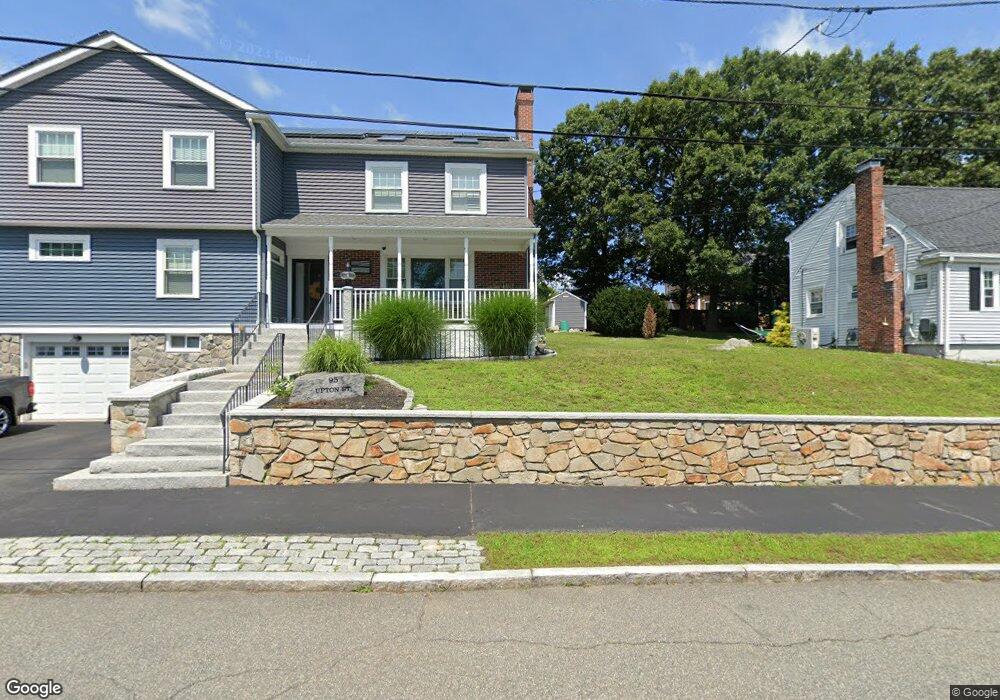
91 Upton St Quincy, MA 02169
Estimated Value: $1,234,661 - $1,377,000
5
Beds
5
Baths
3,407
Sq Ft
$380/Sq Ft
Est. Value
About This Home
This home is located at 91 Upton St, Quincy, MA 02169 and is currently estimated at $1,296,165, approximately $380 per square foot. 91 Upton St is a home located in Norfolk County with nearby schools including Montclair Elementary School, Atlantic Middle School, and North Quincy High School.
Ownership History
Date
Name
Owned For
Owner Type
Purchase Details
Closed on
Jul 16, 2024
Sold by
Hartnett Edward J and Hartnett Lori A
Bought by
Mcgregor Francis G and Mcgregor Joan A
Current Estimated Value
Purchase Details
Closed on
Jul 7, 2011
Sold by
Amelia Difederico Ret
Bought by
Harnett Lori A and Harnett Edward J
Purchase Details
Closed on
Apr 7, 1986
Bought by
Hartnett Lori Ann
Create a Home Valuation Report for This Property
The Home Valuation Report is an in-depth analysis detailing your home's value as well as a comparison with similar homes in the area
Purchase History
| Date | Buyer | Sale Price | Title Company |
|---|---|---|---|
| Mcgregor Francis G | -- | None Available | |
| Mcgregor Francis G | -- | None Available | |
| Harnett Lori A | -- | -- | |
| Hartnett Lori Ann | -- | -- | |
| Harnett Lori A | -- | -- |
Source: Public Records
Mortgage History
| Date | Status | Borrower | Loan Amount |
|---|---|---|---|
| Previous Owner | Hartnett Lori Ann | $280,000 |
Source: Public Records
Tax History
| Year | Tax Paid | Tax Assessment Tax Assessment Total Assessment is a certain percentage of the fair market value that is determined by local assessors to be the total taxable value of land and additions on the property. | Land | Improvement |
|---|---|---|---|---|
| 2025 | $12,441 | $1,079,000 | $320,000 | $759,000 |
| 2024 | $11,474 | $1,018,100 | $305,200 | $712,900 |
| 2023 | $10,618 | $954,000 | $291,100 | $662,900 |
| 2022 | $10,632 | $887,500 | $234,400 | $653,100 |
| 2021 | $10,300 | $848,400 | $234,400 | $614,000 |
| 2020 | $10,543 | $848,200 | $234,400 | $613,800 |
| 2019 | $10,181 | $811,200 | $227,900 | $583,300 |
| 2018 | $10,029 | $751,800 | $211,600 | $540,200 |
| 2017 | $9,789 | $690,800 | $201,900 | $488,900 |
| 2016 | $9,143 | $636,700 | $184,300 | $452,400 |
| 2015 | $8,595 | $588,700 | $174,300 | $414,400 |
| 2014 | $8,325 | $560,200 | $174,300 | $385,900 |
Source: Public Records
Map
Nearby Homes
- 84 Gardiner Rd
- 114 Willard St Unit 4
- 230 Willard St Unit 102
- 41 Wallace Rd
- 440 Granite Ave Unit 201
- 46 Century Ln
- 10 White St
- 40 Cross St Unit 1
- 459 Willard St Unit 303
- 0 Franklin St
- 211 Copeland St
- 510 Willard St
- 406 Beale St
- 3 Horton Place
- 397 Adams St
- 400 Adams St Unit A
- 123 Piermont St
- 281 Elmwood Ave
- 1 Cityview Ln Unit 506
- 1 Cityview Ln Unit 709
Your Personal Tour Guide
Ask me questions while you tour the home.