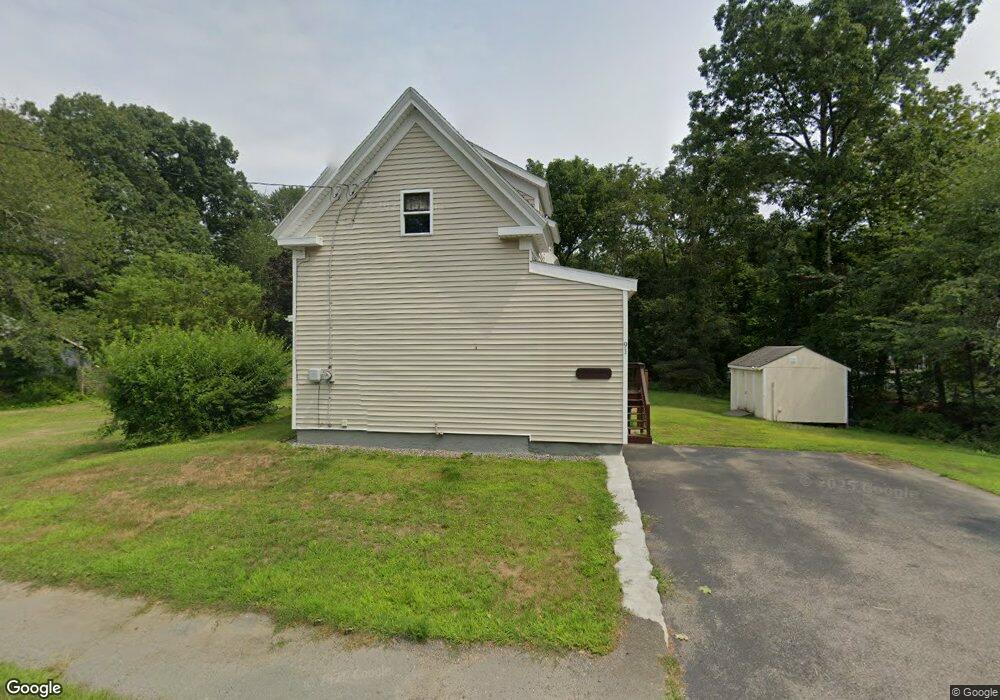
91 Wenham St Danvers, MA 01923
Estimated Value: $579,812 - $785,000
3
Beds
1
Bath
1,268
Sq Ft
$521/Sq Ft
Est. Value
About This Home
This home is located at 91 Wenham St, Danvers, MA 01923 and is currently estimated at $660,203, approximately $520 per square foot. 91 Wenham St is a home located in Essex County with nearby schools including Danvers High School, St. Mary of the Annunciation School, and St. John's Prep.
Ownership History
Date
Name
Owned For
Owner Type
Purchase Details
Closed on
Jul 9, 2020
Sold by
Roush Dana M and Roush Kristin M
Bought by
Roush Dana M and Roush Kristin M
Current Estimated Value
Purchase Details
Closed on
Dec 23, 2013
Sold by
Roush Catherine
Bought by
Roush Dana M and Roush Kristine M
Purchase Details
Closed on
Jan 28, 2008
Sold by
Trudel Jeffrey C and Trudel Susan
Bought by
Roush Dana M and Roush Catherine
Home Financials for this Owner
Home Financials are based on the most recent Mortgage that was taken out on this home.
Original Mortgage
$299,000
Interest Rate
6.17%
Mortgage Type
Purchase Money Mortgage
Purchase Details
Closed on
Aug 3, 1992
Sold by
Arthur Mary K Est
Bought by
Trudel Jeffrey C
Create a Home Valuation Report for This Property
The Home Valuation Report is an in-depth analysis detailing your home's value as well as a comparison with similar homes in the area
Home Values in the Area
Average Home Value in this Area
Purchase History
| Date | Buyer | Sale Price | Title Company |
|---|---|---|---|
| Roush Dana M | -- | None Available | |
| Roush Dana M | -- | -- | |
| Roush Dana M | $299,000 | -- | |
| Trudel Jeffrey C | $80,000 | -- |
Source: Public Records
Mortgage History
| Date | Status | Borrower | Loan Amount |
|---|---|---|---|
| Previous Owner | Trudel Jeffrey C | $290,425 | |
| Previous Owner | Trudel Jeffrey C | $299,000 |
Source: Public Records
Tax History
| Year | Tax Paid | Tax Assessment Tax Assessment Total Assessment is a certain percentage of the fair market value that is determined by local assessors to be the total taxable value of land and additions on the property. | Land | Improvement |
|---|---|---|---|---|
| 2025 | $5,619 | $511,300 | $324,800 | $186,500 |
| 2024 | $5,629 | $506,700 | $324,800 | $181,900 |
| 2023 | $5,344 | $454,800 | $288,000 | $166,800 |
| 2022 | $5,131 | $405,300 | $251,200 | $154,100 |
| 2021 | $4,835 | $362,200 | $227,900 | $134,300 |
| 2020 | $4,712 | $360,800 | $220,600 | $140,200 |
| 2019 | $4,741 | $357,000 | $213,200 | $143,800 |
| 2018 | $4,499 | $332,300 | $207,100 | $125,200 |
| 2017 | $4,437 | $312,700 | $192,400 | $120,300 |
| 2016 | $4,267 | $300,500 | $183,800 | $116,700 |
| 2015 | $3,972 | $266,400 | $159,300 | $107,100 |
Source: Public Records
Map
Nearby Homes
Your Personal Tour Guide
Ask me questions while you tour the home.