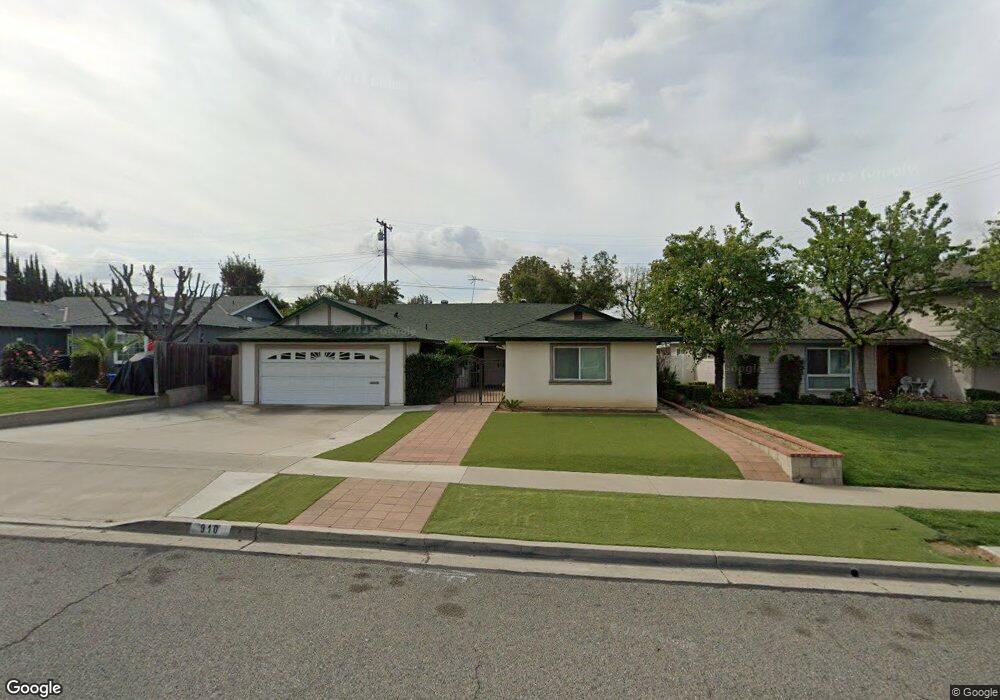
910 Appling Ave Placentia, CA 92870
Estimated Value: $1,145,831 - $1,184,000
4
Beds
3
Baths
1,937
Sq Ft
$597/Sq Ft
Est. Value
About This Home
This home is located at 910 Appling Ave, Placentia, CA 92870 and is currently estimated at $1,156,458, approximately $597 per square foot. 910 Appling Ave is a home located in Orange County with nearby schools including Wagner Elementary School, Col. J. K. Tuffree Middle School, and El Dorado High School.
Ownership History
Date
Name
Owned For
Owner Type
Purchase Details
Closed on
Feb 10, 2015
Sold by
Lan Roberto Ming Chu and Lan Olive Ying Huei
Bought by
Lan Family Trust
Current Estimated Value
Create a Home Valuation Report for This Property
The Home Valuation Report is an in-depth analysis detailing your home's value as well as a comparison with similar homes in the area
Home Values in the Area
Average Home Value in this Area
Purchase History
| Date | Buyer | Sale Price | Title Company |
|---|---|---|---|
| Lan Family Trust | -- | None Available |
Source: Public Records
Tax History
| Year | Tax Paid | Tax Assessment Tax Assessment Total Assessment is a certain percentage of the fair market value that is determined by local assessors to be the total taxable value of land and additions on the property. | Land | Improvement |
|---|---|---|---|---|
| 2025 | $5,232 | $417,463 | $260,058 | $157,405 |
| 2024 | $5,232 | $409,278 | $254,959 | $154,319 |
| 2023 | $5,105 | $401,253 | $249,959 | $151,294 |
| 2022 | $5,007 | $393,386 | $245,058 | $148,328 |
| 2021 | $4,869 | $385,673 | $240,253 | $145,420 |
| 2020 | $4,814 | $381,719 | $237,790 | $143,929 |
| 2019 | $4,617 | $374,235 | $233,128 | $141,107 |
| 2018 | $4,555 | $366,898 | $228,557 | $138,341 |
| 2017 | $4,475 | $359,704 | $224,075 | $135,629 |
| 2016 | $4,090 | $325,465 | $219,681 | $105,784 |
| 2015 | $3,833 | $302,123 | $216,381 | $85,742 |
| 2014 | $3,727 | $296,205 | $212,142 | $84,063 |
Source: Public Records
Map
Nearby Homes
- 630 Shady Ln
- 724 Longfellow Dr
- 2123 Earnshaw Dr
- 2102 Mignon Way
- 1837 Kelleher Place
- 5142 Hamer Ln
- 1509 Prospect Ave Unit D
- 1418 Avenida de Vaca
- 408 Somerset Dr
- 4469 La Serena Dr
- 1232 Woodside Dr
- 2313 Navigation Cir
- 1410 Via Cortez
- 324 Rio Grande Ave
- 455 Purdy Ave
- 931 Carina Ave
- 1254 Venice Ave
- 1963 Wilcox Unit 4-6
- 1308 Montevideo Ave
- 308 Somerset Dr
- 906 Appling Ave
- 914 Appling Ave
- 909 Huggins Ave
- 918 Appling Ave
- 902 Appling Ave
- 905 Huggins Ave
- 913 Huggins Ave
- 901 Huggins Ave
- 919 Huggins Ave
- 909 Appling Ave
- 913 Appling Ave
- 922 Appling Ave
- 905 Appling Ave
- 917 Appling Ave
- 901 Appling Ave
- 923 Huggins Ave
- 921 Appling Ave
- 926 Appling Ave
- 1725 Mccormack Ln
- 1731 Mccormack Ln
Your Personal Tour Guide
Ask me questions while you tour the home.