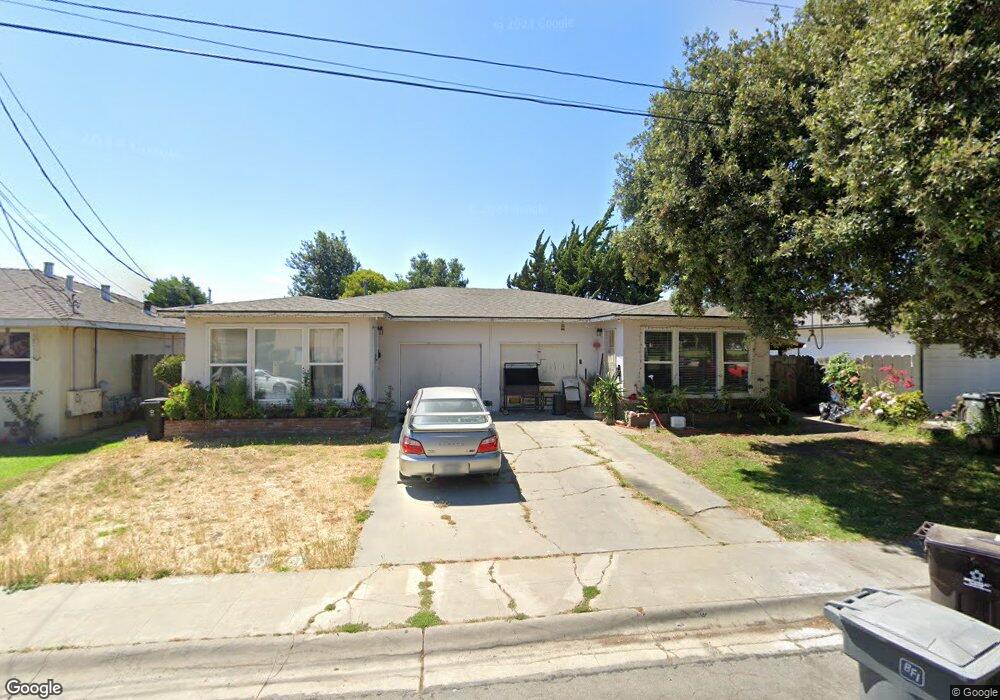
910 Bautista Dr Salinas, CA 93901
South Salinas NeighborhoodEstimated Value: $733,000 - $823,000
4
Beds
2
Baths
1,690
Sq Ft
$458/Sq Ft
Est. Value
About This Home
This home is located at 910 Bautista Dr, Salinas, CA 93901 and is currently estimated at $774,069, approximately $458 per square foot. 910 Bautista Dr is a home located in Monterey County with nearby schools including Lincoln Elementary School, Mission Park Elementary School, and Monterey Park Elementary School.
Ownership History
Date
Name
Owned For
Owner Type
Purchase Details
Closed on
Oct 20, 2022
Sold by
Kim Peter and Kim Jamie Chom
Bought by
Kim Family Trust
Current Estimated Value
Purchase Details
Closed on
Jun 23, 2015
Sold by
Glenn Verdan R and Glenn Sylvia L
Bought by
Kim Peter and Kim Jamie Chom
Home Financials for this Owner
Home Financials are based on the most recent Mortgage that was taken out on this home.
Original Mortgage
$274,000
Interest Rate
4.01%
Mortgage Type
New Conventional
Create a Home Valuation Report for This Property
The Home Valuation Report is an in-depth analysis detailing your home's value as well as a comparison with similar homes in the area
Home Values in the Area
Average Home Value in this Area
Purchase History
| Date | Buyer | Sale Price | Title Company |
|---|---|---|---|
| Kim Family Trust | -- | -- | |
| Kim Peter | $399,000 | Old Republic Title Company |
Source: Public Records
Mortgage History
| Date | Status | Borrower | Loan Amount |
|---|---|---|---|
| Previous Owner | Kim Peter | $274,000 |
Source: Public Records
Tax History
| Year | Tax Paid | Tax Assessment Tax Assessment Total Assessment is a certain percentage of the fair market value that is determined by local assessors to be the total taxable value of land and additions on the property. | Land | Improvement |
|---|---|---|---|---|
| 2025 | $5,419 | $472,328 | $177,566 | $294,762 |
| 2024 | $5,419 | $463,068 | $174,085 | $288,983 |
| 2023 | $5,237 | $453,989 | $170,672 | $283,317 |
| 2022 | $5,039 | $445,088 | $167,326 | $277,762 |
| 2021 | $4,840 | $436,362 | $164,046 | $272,316 |
| 2020 | $4,706 | $431,888 | $162,364 | $269,524 |
| 2019 | $4,671 | $423,421 | $159,181 | $264,240 |
| 2018 | $4,613 | $415,119 | $156,060 | $259,059 |
| 2017 | $4,617 | $406,980 | $153,000 | $253,980 |
| 2016 | $4,621 | $399,000 | $150,000 | $249,000 |
| 2015 | $2,978 | $249,991 | $64,971 | $185,020 |
| 2014 | $2,779 | $245,095 | $63,699 | $181,396 |
Source: Public Records
Map
Nearby Homes
- 1051 Riker St Unit 7
- 1052 Padre Dr Unit 3
- 138 Nissen Rd Unit 1
- 1051 Padre Dr Unit 7
- 1056 Padre Dr Unit 4
- 134 Nissen Rd Unit 2
- 1067 Padre Dr Unit 2
- 1067 Padre Dr Unit 1
- 1055 Padre Dr Unit 2
- 330 Woodside Dr Unit 105
- 805 Iverson St
- 15 Del Rey Cir
- 50 Katherine Ave
- 141 Del Mar Dr
- 54 Katherine Ave
- 40 Oak St
- 22 Willow St
- 813 Pajaro St
- 116 Oak St
- 14 San Juan Dr
Your Personal Tour Guide
Ask me questions while you tour the home.