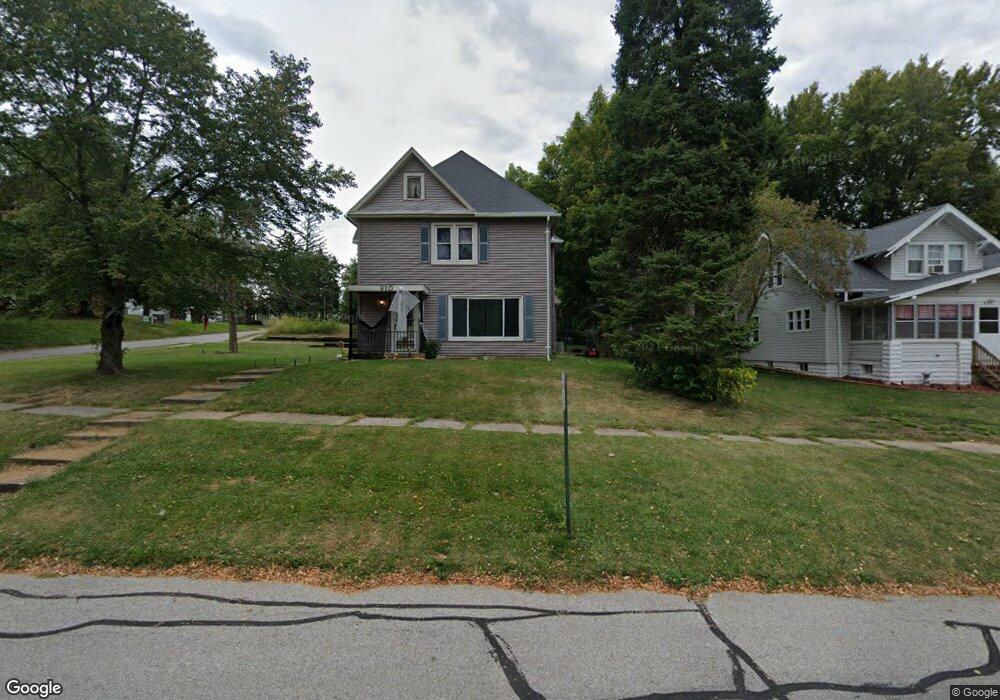
910 Court St Harlan, IA 51537
Estimated Value: $136,000 - $190,000
3
Beds
2
Baths
1,924
Sq Ft
$85/Sq Ft
Est. Value
About This Home
This home is located at 910 Court St, Harlan, IA 51537 and is currently estimated at $163,780, approximately $85 per square foot. 910 Court St is a home located in Shelby County with nearby schools including Harlan Primary School, Harlan Intermediate School, and Harlan Community Middle School.
Ownership History
Date
Name
Owned For
Owner Type
Purchase Details
Closed on
Oct 24, 2024
Sold by
Conrad Linda K
Bought by
Conrad Dale E
Current Estimated Value
Purchase Details
Closed on
Mar 26, 2010
Sold by
Johnson Jeff L and Muell Annie J
Bought by
Nichols Stephen R
Home Financials for this Owner
Home Financials are based on the most recent Mortgage that was taken out on this home.
Original Mortgage
$76,764
Interest Rate
5%
Mortgage Type
USDA
Purchase Details
Closed on
Oct 16, 2006
Sold by
Federal National Mortgage Association
Bought by
Johnson Jeff L and Johnson Annie J
Home Financials for this Owner
Home Financials are based on the most recent Mortgage that was taken out on this home.
Original Mortgage
$60,400
Interest Rate
6.5%
Mortgage Type
Future Advance Clause Open End Mortgage
Purchase Details
Closed on
Mar 20, 2006
Sold by
Keesling Matthew J
Bought by
Phh Mortgage Group
Create a Home Valuation Report for This Property
The Home Valuation Report is an in-depth analysis detailing your home's value as well as a comparison with similar homes in the area
Home Values in the Area
Average Home Value in this Area
Purchase History
| Date | Buyer | Sale Price | Title Company |
|---|---|---|---|
| Conrad Dale E | -- | None Listed On Document | |
| Nichols Stephen R | $73,000 | -- | |
| Johnson Jeff L | -- | None Available | |
| Phh Mortgage Group | $123,286 | None Available |
Source: Public Records
Mortgage History
| Date | Status | Borrower | Loan Amount |
|---|---|---|---|
| Previous Owner | Nichols Stephen R | $76,764 | |
| Previous Owner | Johnson Jeff L | $60,400 |
Source: Public Records
Tax History Compared to Growth
Tax History
| Year | Tax Paid | Tax Assessment Tax Assessment Total Assessment is a certain percentage of the fair market value that is determined by local assessors to be the total taxable value of land and additions on the property. | Land | Improvement |
|---|---|---|---|---|
| 2025 | $1,894 | $115,567 | $15,400 | $100,167 |
| 2024 | $1,894 | $101,258 | $15,400 | $85,858 |
| 2023 | $1,768 | $103,604 | $15,400 | $88,204 |
| 2022 | $1,768 | $84,933 | $15,400 | $69,533 |
| 2021 | $1,656 | $84,933 | $15,400 | $69,533 |
| 2020 | $1,622 | $79,021 | $15,400 | $63,621 |
| 2019 | $1,534 | $72,962 | $0 | $0 |
| 2018 | $1,318 | $72,962 | $0 | $0 |
| 2017 | $1,318 | $72,962 | $0 | $0 |
| 2016 | $1,572 | $83,962 | $0 | $0 |
| 2015 | $1,572 | $81,549 | $0 | $0 |
| 2014 | $1,520 | $81,549 | $0 | $0 |
Source: Public Records
Map
Nearby Homes