Estimated Value: $1,972,000 - $2,534,000
4
Beds
4
Baths
3,869
Sq Ft
$571/Sq Ft
Est. Value
About This Home
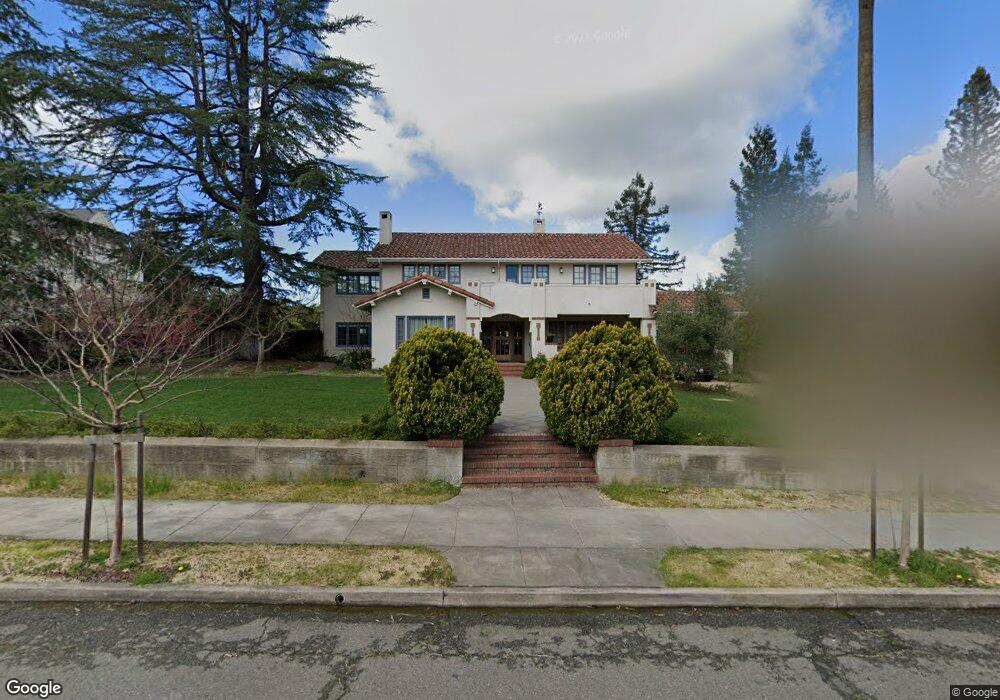
This home is located at 910 D St, Petaluma, CA 94952 and is currently estimated at $2,210,511, approximately $571 per square foot. 910 D St is a home located in Sonoma County with nearby schools including McNear Elementary School, Petaluma Junior High School, and Petaluma High School.
Ownership History
Date
Name
Owned For
Owner Type
Purchase Details
Closed on
Feb 13, 2018
Sold by
Fornage Martin and Fornage Julia Ann
Bought by
Fornage Martin and Fornage Julia Ann
Current Estimated Value
Purchase Details
Closed on
Apr 1, 2011
Sold by
Fornage Martin
Bought by
Fornage Martin and Fornage Julia
Purchase Details
Closed on
Mar 8, 2011
Sold by
Leoni Peter V and Peterson Kathleen A
Bought by
Fornage Martin
Purchase Details
Closed on
Aug 24, 2005
Sold by
Martini Kathleen Ann E and Martini Lawrence E
Bought by
Leoni Peter V and Peterson Kathleen A
Home Financials for this Owner
Home Financials are based on the most recent Mortgage that was taken out on this home.
Original Mortgage
$1,200,000
Interest Rate
6.25%
Mortgage Type
Commercial
Purchase Details
Closed on
Aug 23, 2000
Sold by
Martini Lawrence E and The Lawrence E & June R Martin
Bought by
Martini Lawrence E E and Martini Lawrence E
Purchase Details
Closed on
Apr 23, 1997
Sold by
Martini Lawrence E and Martini June R
Bought by
Martini Lawrence E and Martini June R
Create a Home Valuation Report for This Property
The Home Valuation Report is an in-depth analysis detailing your home's value as well as a comparison with similar homes in the area
Home Values in the Area
Average Home Value in this Area
Purchase History
| Date | Buyer | Sale Price | Title Company |
|---|---|---|---|
| Fornage Martin | -- | None Available | |
| Fornage Martin | -- | Fidelity National Title Co | |
| Fornage Martin | $760,050 | Fidelity Natl Title Co | |
| Leoni Peter V | $1,600,000 | Fidelity Natl Title Co | |
| Martini Lawrence E E | -- | -- | |
| Martini Lawrence E | -- | -- |
Source: Public Records
Mortgage History
| Date | Status | Borrower | Loan Amount |
|---|---|---|---|
| Previous Owner | Leoni Peter V | $1,200,000 |
Source: Public Records
Tax History
| Year | Tax Paid | Tax Assessment Tax Assessment Total Assessment is a certain percentage of the fair market value that is determined by local assessors to be the total taxable value of land and additions on the property. | Land | Improvement |
|---|---|---|---|---|
| 2025 | $20,906 | $1,974,376 | $448,405 | $1,525,971 |
| 2024 | $20,906 | $1,935,663 | $439,613 | $1,496,050 |
| 2023 | $20,906 | $1,897,710 | $430,994 | $1,466,716 |
| 2022 | $20,392 | $1,860,501 | $422,544 | $1,437,957 |
| 2021 | $20,003 | $1,824,021 | $414,259 | $1,409,762 |
| 2020 | $20,176 | $1,805,319 | $410,012 | $1,395,307 |
| 2019 | $19,923 | $1,769,922 | $401,973 | $1,367,949 |
| 2018 | $19,845 | $1,735,219 | $394,092 | $1,341,127 |
| 2017 | $19,424 | $1,701,196 | $386,365 | $1,314,831 |
| 2016 | $18,983 | $1,667,840 | $378,790 | $1,289,050 |
| 2015 | $18,715 | $1,642,789 | $373,101 | $1,269,688 |
| 2014 | $18,703 | $1,610,610 | $365,793 | $1,244,817 |
Source: Public Records
Map
Nearby Homes
- 1309 D Street Extension
- 100 Orchard Ln
- 617 G St
- 301 Broadway St
- 519 7th St
- 12 Haven Dr
- 131 Liberty St
- 136 Court St
- 21 Branching Way
- 156 Grant Ct
- 426 1st St
- 720 Petaluma Blvd S Unit 28
- 611 Petaluma Blvd S
- 852 Western Ave
- 22 Oak Knoll Ct
- 888 Petaluma Blvd S
- 232 Cambridge Ln
- 331 Keller St Unit 6
- 1028 Addison Cir
- 0 Lakeville St
Your Personal Tour Guide
Ask me questions while you tour the home.