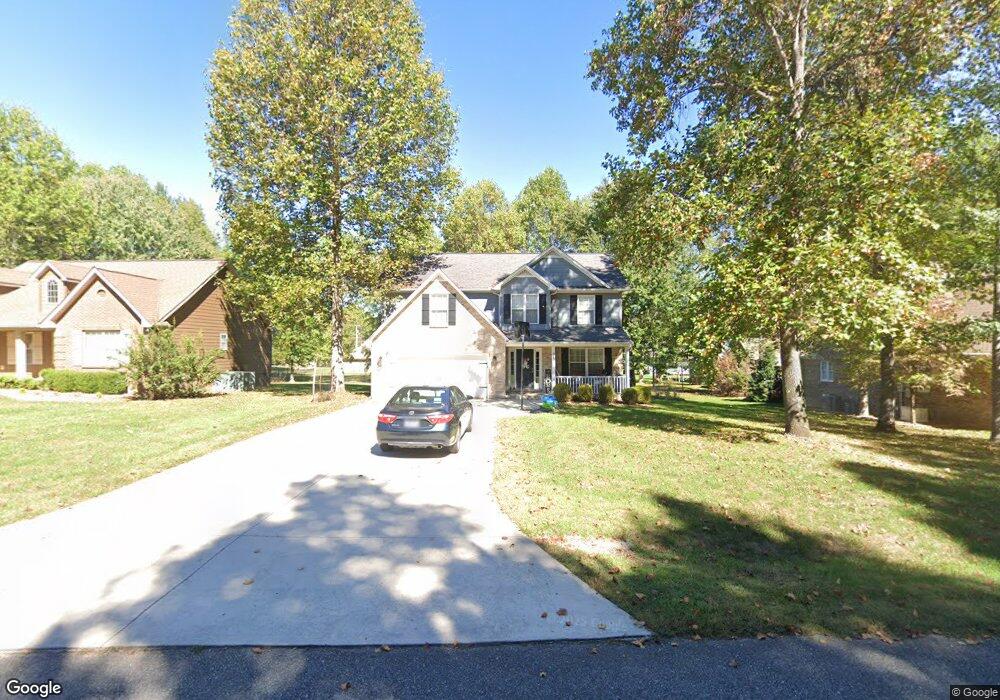
910 Evelyn Ct Cookeville, TN 38506
Estimated Value: $379,259 - $488,000
3
Beds
3
Baths
2,028
Sq Ft
$213/Sq Ft
Est. Value
About This Home
This home is located at 910 Evelyn Ct, Cookeville, TN 38506 and is currently estimated at $432,565, approximately $213 per square foot. 910 Evelyn Ct is a home located in Putnam County with nearby schools including Cookeville High School, Algood Elementary School, and Algood Middle School.
Ownership History
Date
Name
Owned For
Owner Type
Purchase Details
Closed on
Sep 29, 2011
Sold by
Phillips Bobby
Bought by
Hancock Matthew D
Current Estimated Value
Home Financials for this Owner
Home Financials are based on the most recent Mortgage that was taken out on this home.
Original Mortgage
$189,000
Outstanding Balance
$129,896
Interest Rate
4.26%
Mortgage Type
VA
Estimated Equity
$302,669
Purchase Details
Closed on
Apr 5, 2011
Sold by
Harville Amie M
Bought by
Phillips Bobby and Phillips Steve
Home Financials for this Owner
Home Financials are based on the most recent Mortgage that was taken out on this home.
Original Mortgage
$140,000
Interest Rate
4.85%
Mortgage Type
Commercial
Purchase Details
Closed on
Mar 4, 2009
Sold by
Master Builders Llc
Bought by
Harville Amie M
Home Financials for this Owner
Home Financials are based on the most recent Mortgage that was taken out on this home.
Original Mortgage
$166,300
Interest Rate
5.29%
Purchase Details
Closed on
Jan 15, 2008
Bought by
Master Builders Llc
Purchase Details
Closed on
Jul 31, 1978
Bought by
Phillips Lonnie A and Phillips Margaret R Ph
Purchase Details
Closed on
Oct 19, 1976
Bought by
Phillips Lonnie A and Phillips Margaret R Ph
Create a Home Valuation Report for This Property
The Home Valuation Report is an in-depth analysis detailing your home's value as well as a comparison with similar homes in the area
Home Values in the Area
Average Home Value in this Area
Purchase History
| Date | Buyer | Sale Price | Title Company |
|---|---|---|---|
| Hancock Matthew D | $189,000 | -- | |
| Phillips Bobby | $209,000 | -- | |
| Harville Amie M | $185,000 | -- | |
| Master Builders Llc | $75,000 | -- | |
| Phillips Lonnie A | -- | -- | |
| Phillips Lonnie A | -- | -- |
Source: Public Records
Mortgage History
| Date | Status | Borrower | Loan Amount |
|---|---|---|---|
| Open | Hancock Matthew D | $189,000 | |
| Previous Owner | Phillips Bobby | $140,000 | |
| Previous Owner | Phillips Lonnie A | $166,300 |
Source: Public Records
Tax History Compared to Growth
Tax History
| Year | Tax Paid | Tax Assessment Tax Assessment Total Assessment is a certain percentage of the fair market value that is determined by local assessors to be the total taxable value of land and additions on the property. | Land | Improvement |
|---|---|---|---|---|
| 2024 | $1,656 | $62,250 | $8,500 | $53,750 |
| 2023 | $1,656 | $62,250 | $8,500 | $53,750 |
| 2022 | $1,539 | $62,250 | $8,500 | $53,750 |
| 2021 | $1,607 | $65,000 | $8,500 | $56,500 |
| 2020 | $1,597 | $65,000 | $8,500 | $56,500 |
| 2019 | $1,597 | $54,575 | $8,500 | $46,075 |
| 2018 | $1,490 | $54,575 | $8,500 | $46,075 |
| 2017 | $1,472 | $53,925 | $8,500 | $45,425 |
| 2016 | $1,472 | $53,925 | $8,500 | $45,425 |
| 2015 | $1,513 | $53,925 | $8,500 | $45,425 |
| 2014 | $1,437 | $51,217 | $0 | $0 |
Source: Public Records
Map
Nearby Homes
- 902 Evelyn Ct
- 5004 Curtis Way
- 4887 Hilham Rd
- 0 Bear Creek Cir
- 5898 Hilham Rd
- 1081 Cynthia St
- 2035 Bear Creek Point
- 3429 Wj Robinson Rd
- 1663 Paran Rd
- 3435 Northwind Dr
- 1916 Bear Creek Point
- 3011 Zeb Warren Rd
- 6538 Hilham Rd
- 6538 6538 Hilham Rd
- 1522 Post Oak Rd
- 447 W Bangham Rd
- 2908 Deerhaven Dr S
- 3006 Deerhaven Dr N
- 906 Evelyn Ct
- 914 Evelyn Ct
- 911 Curtiswood Ct
- 915 Curtiswood Ct
- 4935 Curtis Dr
- 905 Evelyn Ct
- 907 Curtiswood Ct
- 4939 Curtis Dr
- 4925 Curtis Dr
- 4943 Curtis Dr
- 1966 Curtis Dr
- 908 Curtiswood Ct
- 4921 Curtis Dr
- 916 Curtiswood Ct
- 4930 Curtis Dr
- 1149 Green Meadow Rd
- 1241 Green Meadow Rd
- 4942 Curtis Dr
- 4946 Curtis Dr
- 4950 Curtis Dr