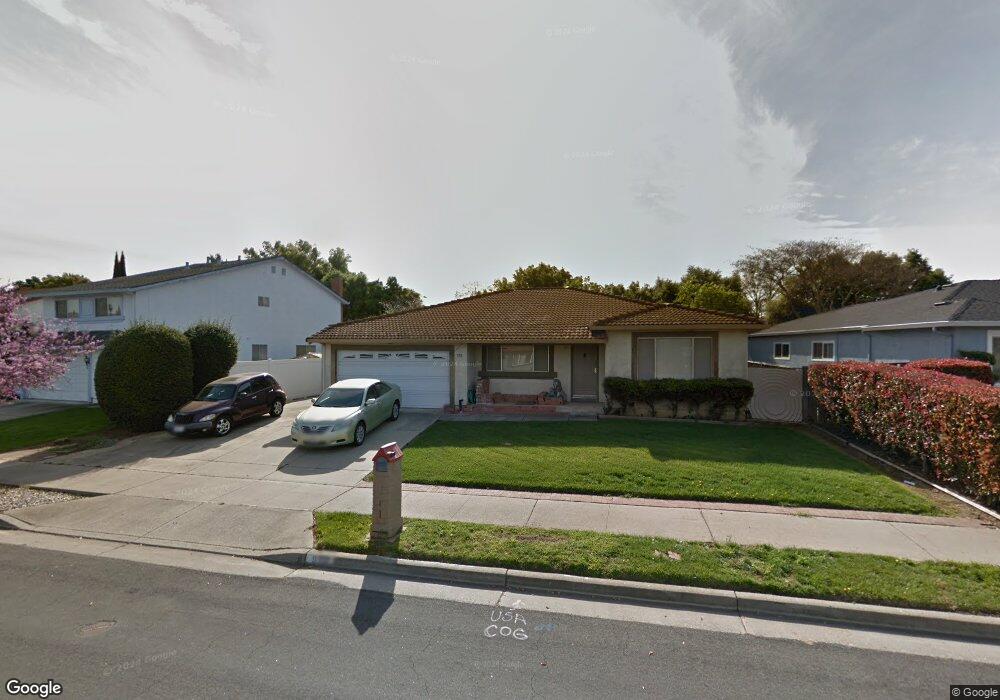
910 Greenwich Dr Gilroy, CA 95020
Estimated Value: $947,000 - $1,065,000
4
Beds
2
Baths
2,147
Sq Ft
$473/Sq Ft
Est. Value
About This Home
This home is located at 910 Greenwich Dr, Gilroy, CA 95020 and is currently estimated at $1,014,502, approximately $472 per square foot. 910 Greenwich Dr is a home located in Santa Clara County with nearby schools including Glen View Elementary School, Solorsano Middle School, and Gilroy High School.
Ownership History
Date
Name
Owned For
Owner Type
Purchase Details
Closed on
Aug 30, 2021
Sold by
Glover Judith F
Bought by
Glover Judith F and Judith F Glover Rev Tr
Current Estimated Value
Home Financials for this Owner
Home Financials are based on the most recent Mortgage that was taken out on this home.
Original Mortgage
$508,500
Outstanding Balance
$462,697
Interest Rate
2.8%
Mortgage Type
New Conventional
Estimated Equity
$551,805
Purchase Details
Closed on
Mar 3, 2021
Sold by
Glover Judith Flores
Bought by
Glover Judith F and Judith F Glover Revocable Trus
Purchase Details
Closed on
May 10, 1999
Sold by
Glover Darrell Ray Cranville
Bought by
Glover Judith Flores
Home Financials for this Owner
Home Financials are based on the most recent Mortgage that was taken out on this home.
Original Mortgage
$240,000
Interest Rate
6.92%
Purchase Details
Closed on
Jul 14, 1993
Sold by
Glover Darrell Ray Granville
Bought by
Glover Judith Flores
Create a Home Valuation Report for This Property
The Home Valuation Report is an in-depth analysis detailing your home's value as well as a comparison with similar homes in the area
Home Values in the Area
Average Home Value in this Area
Purchase History
| Date | Buyer | Sale Price | Title Company |
|---|---|---|---|
| Glover Judith F | -- | Atlas Title Company | |
| Glover Judith F | -- | Atlas Title Company | |
| Glover Judith F | -- | None Available | |
| Glover Judith Flores | -- | First American Title Co | |
| Glover Judith Flores | -- | -- |
Source: Public Records
Mortgage History
| Date | Status | Borrower | Loan Amount |
|---|---|---|---|
| Open | Glover Judith F | $508,500 | |
| Closed | Glover Judith Flores | $240,000 |
Source: Public Records
Tax History
| Year | Tax Paid | Tax Assessment Tax Assessment Total Assessment is a certain percentage of the fair market value that is determined by local assessors to be the total taxable value of land and additions on the property. | Land | Improvement |
|---|---|---|---|---|
| 2025 | $2,762 | $218,749 | $65,288 | $153,461 |
| 2024 | $2,762 | $214,460 | $64,008 | $150,452 |
| 2023 | $2,745 | $210,255 | $62,753 | $147,502 |
| 2022 | $2,699 | $206,133 | $61,523 | $144,610 |
| 2021 | $2,597 | $202,092 | $60,317 | $141,775 |
| 2020 | $2,568 | $200,021 | $59,699 | $140,322 |
| 2019 | $2,543 | $196,100 | $58,529 | $137,571 |
| 2018 | $2,377 | $192,256 | $57,382 | $134,874 |
| 2017 | $2,422 | $188,487 | $56,257 | $132,230 |
| 2016 | $2,364 | $184,792 | $55,154 | $129,638 |
| 2015 | $2,232 | $182,017 | $54,326 | $127,691 |
| 2014 | $2,216 | $178,452 | $53,262 | $125,190 |
Source: Public Records
Map
Nearby Homes
- 7100 Potomac Place
- 750 W 9th St
- 6389 Tawhana Ln
- 1140 Bonino Way
- 6735 Stephan Ct
- 500 W 10th St Unit 177
- 7360 Ailes Ct
- Plan 2 at Heritage on 6th Street
- Plan 1 at Heritage on 6th Street
- 7351 Princevalle St Unit Homesite 18
- 7376 Ailes Ct
- 751 W 6th St
- 6595 Princevalle St
- 7384 Ailes Ct
- 1188 Viognier Way
- 6565 Princevalle St
- 7460 Miller Ave
- 7310 Carmel St
- 1387 Ores Way
- 925 Blake Ct
- 920 Greenwich Dr
- 930 Greenwich Dr
- 7030 Yorktown Dr
- 915 Greenwich Dr
- 905 Greenwich Dr
- 880 Greenwich Dr
- 7040 Yorktown Dr
- 7025 Yorktown Dr
- 900 Chesapeake Place
- 870 Greenwich Dr
- 910 Chesapeake Place
- 885 Greenwich Dr
- 890 Chesapeake Place
- 7050 Yorktown Dr
- 880 Chesapeake Place
- 875 Greenwich Dr
- 860 Greenwich Dr
- 7045 Yorktown Dr
- 925 Chesapeake Place
- 7060 Yorktown Dr
Your Personal Tour Guide
Ask me questions while you tour the home.